Getting Started with OpenOCD: A Beginner’s Guide for Embedded Developers
A beginner-friendly guide to installing, configuring, and using OpenOCD for flashing and debugging microcontrollers.


This post is part of the Tools as a Service Series. Full architecture overview here.
If you're anything like me, you probably have a set of go-to tools you love, and you genuinely appreciate the freedom to choose what fits your workflow best. That’s exactly why vendor-specific ecosystems can be frustrating for embedded developers, especially when they force you into proprietary debuggers and utilities. Each new microcontroller family often means starting over, learning new tools instead of focusing on development.
This is where getting started with OpenOCD can really simplify things. OpenOCD, short for Open On-Chip Debugger, is a powerful open-source, cross-platform tool that provides a consistent debugging foundation across projects. It lets you flash firmware and debug targets using GDB, and it supports a wide range of microcontrollers (such as STM32, RP2040, ESP32) and debug probes (including ST-Link, CMSIS-DAP, J-Link).
Curious how it works? In this beginner’s guide I’ll walk you through the basics, show you how to install it and get started!
How Does OpenOCD Work?
OpenOCD acts as a bridge between your debugger software and your physical embedded device (the microcontroller). It connects to your board over a debug interface like SWD or JTAG, using a debug probe.

Once the hardware connections are done, running OpenOCD will start several servers, most notably a GDB server . The debugger (e.g. arm-none-eabi-gdb) connects to OpenOCD GDB server which provides high level interface to issue commands. OpenOCD translates these commands into low-level commands that are specific to the chosen debug probe and target controller.
In essence it abstracts away complex low-level hardware communication, providing a standardized interface for various debug probes and embedded targets.
Installing OpenOCD (Linux/Debian)
On a Debian-based machine (Ubuntu/Mint/Pi OS), installing OpenOCD is straightforward:
sudo apt update
sudo apt install openocdFor Ubuntu 24.04.02, the latest OpenOCD version available via apt is 0.12.0-1.
Verify that openocd is installed:
$ openocd --version
Open On-Chip Debugger 0.12.0
Licensed under GNU GPL v2
For bug reports, read
	http://openocd.org/doc/doxygen/bugs.html
Installing OpenOCD (Windows and MacOS)
For Windows and macOS, the easiest way to acquire OpenOCD is by using the xPack project binaries, available for download from GitHub.
After downloading and extracting the files, you will need to add the xPack OpenOCD /bin and /openocd/scripts directories to the system path. The scripts directory is needed for OpenOCD to locate the /target and /interface scripts.
Once system path is updated, open a terminal and verify the installation:
$ openocd --version
xPack Open On-Chip Debugger 0.12.0+dev-01312-g18281b0c4-dirty (2023-09-04-22:32)
Licensed under GNU GPL v2
For bug reports, read
        http://openocd.org/doc/doxygen/bugs.html
Flashing and Debugging a NUCLEO Board
For this example I will be using an STMicroelectronics NUCLEO board. So let's walk through flashing the microcontroller using the onboard ST-Link debug probe.
OpenOCD typically just needs two configuration files, one for the interface and one for the target. When you are using any of the NUCELO boards the interface file should be interface/stlink.cfg.
For the target you need to choose the correct controller for your specific board. In my case, since I have the STM32F103RB chip, I'll use the target/stm32f1x.cfg file.
To see all supported microcontrollers, take a look at OpenOCD's target directory. And it is possible to write your own configuration files, but more on that another time.
Step 1: Connect Hardware and Run OpenOCD
$ openocd -f interface/stlink.cfg -f target/stm32f1x.cfg
Open On-Chip Debugger 0.12.0
Licensed under GNU GPL v2
For bug reports, read
	http://openocd.org/doc/doxygen/bugs.html
Info : auto-selecting first available session transport "hla_swd". To override use 'transport select <transport>'.
Info : The selected transport took over low-level target control. The results might differ compared to plain JTAG/SWD
Info : Listening on port 6666 for tcl connections
Info : Listening on port 4444 for telnet connections
Info : clock speed 1000 kHz
Info : STLINK V2J33M25 (API v2) VID:PID 0483:374B
Info : Target voltage: 3.255680
Info : [stm32f1x.cpu] Cortex-M3 r1p1 processor detected
Info : [stm32f1x.cpu] target has 6 breakpoints, 4 watchpoints
Info : starting gdb server for stm32f1x.cpu on 3333
Info : Listening on port 3333 for gdb connections
Step 2: Connect GDB
Open a new terminal window and run the arm-none-eabi-gdb with the desired binary:
arm-none-eabi-gdb blinky.elfOnce inside the GDB prompt, execute the following commands:
target remote localhost:3333
monitor reset halt
load
continue
These commands will perform the following actions. First, GDB will connect to the OpenOCD server running on your machine (localhost) on port 3333. Then OpenOCD will reset the target and halt its execution. The load command will then flash the binary provided to GDB (blinky.elf) onto the target. Finally, continue will instruct the target to resume its execution.
Congratulations — you’re now debugging a microcontroller using OpenOCD! You are now FREE from the Vendors grip.

Debugging With VS Code
While debugging in a terminal can certainly make you feel like a real "hackerman", integrating OpenOCD with an IDE offers many quality-of-life improvements, as we would not want to fall short of vendor-provided IDEs, would we!OpenOCD integrates with many popular IDEs and text editors, including Clion, Eclipse and VS Code. I'll show you how to set up debugging in VS Code, which is my go-to editor.
First we need to install a community extension, called "Cortex-Debug" by marus25 (Found under VS Codes Extensions Marketplace). Once we have it installed, we need to create a launch.json file in the .vscode directory. This file will define how the debugging is setup.
{
    "version": "0.2.0",
    "configurations": [
        {
            "name": "Debug with OpenOCD",
            "type": "cortex-debug",
            "request": "launch",
            "executable": "${workspaceFolder/out/blinky.elf",
            "servertype": "openocd",
            "toolchainPrefix": "arm-none-eabi",
            "device": "STM32F103",
            "interface": "swd",
            "svdFile": ".svd/STM32F103.svd",
            "configFiles": [
                "interface/stlink.cfg",
                "target/stm32f1x.cfg"
            ],
            "postRestartCommands": [
                "break main",
                "continue"
            ],
            "showDevDebugOutput": "none"
        }
    ]
}
Let's go over some of the fields:
requestDefines the type of debug session,launchwill start a new debug session (typically flashing and running the program), whileattachconnects to an already running program.executablethis will be the program we want to flash and debugservertypewhich type of GDB server we are communicating with (other options would bejlinkandpyocd)svdFilepoints to the System View Description (.svd) file that describes target peripheral which can give us a human-readable view of peripheral registers and their values during debuggingconfigFilesare the same files we provided on the command linepostRestartCommandsthese are GDB commands that will be executed after the target is reset, when first flashed or when reset during a debug session. In this example we set a break point atmainto stop program execution.
Now, when we click the Debug tab in VS Code and start our debugging session, we'll be able to step through our code directly, inspect variable and register values, and even monitor peripheral values.


What’s Next?
While debugging on your local machine is incredibly useful, the true power of OpenOCD extends far beyond. Have you ever wished you could have a dedicated, low-power debugging station, perhaps accessible from anywhere in your home or office?
In the next post, we'll explore Remote Debugging with OpenOCD on Raspberry Pi - how to set up your own dedicated development server!
All Posts in This Series
- Part 1: Getting Started with OpenOCD: A Beginner's Guide (Current Post)
- Part 2: How to Use a Raspberry Pi as a Remote OpenOCD Debugger
- Part 3: Cross-Compiling OpenOCD: A Step-by-Step Walkthrough
- Part 4: Simplifying OpenOCD Deployment with a Debian Package
- Part 5: Automating OpenOCD Distribution with a Private Gitea Package Registry
- Part 6: Running OpenOCD in Docker: A "Tools as Service" Approach to Embedded DevOps
- Part 7: Creating a Containerized Remote Serial Interface with Docker and Socat
- Part 8: Remote View Raspberry Pi Camera Stream with Docker
Automating OpenOCD Distribution with a Private Gitea Package Registry
Turn your OpenOCD updates from a manual chore into a one-click process. Learn how to set up a private Gitea Package Registry, upload .deb files, and install them effortlessly on any Debian-based machine. Automation made simple.

DNS Sinkhole: How to Block Malicious Sites and Trackers at the Network Level
Deploy Pi-hole on a Raspberry Pi to block malicious domains and trackers network-wide. Learn how to configure blocklists and prevent DNS bypasses in this hands-on guide.
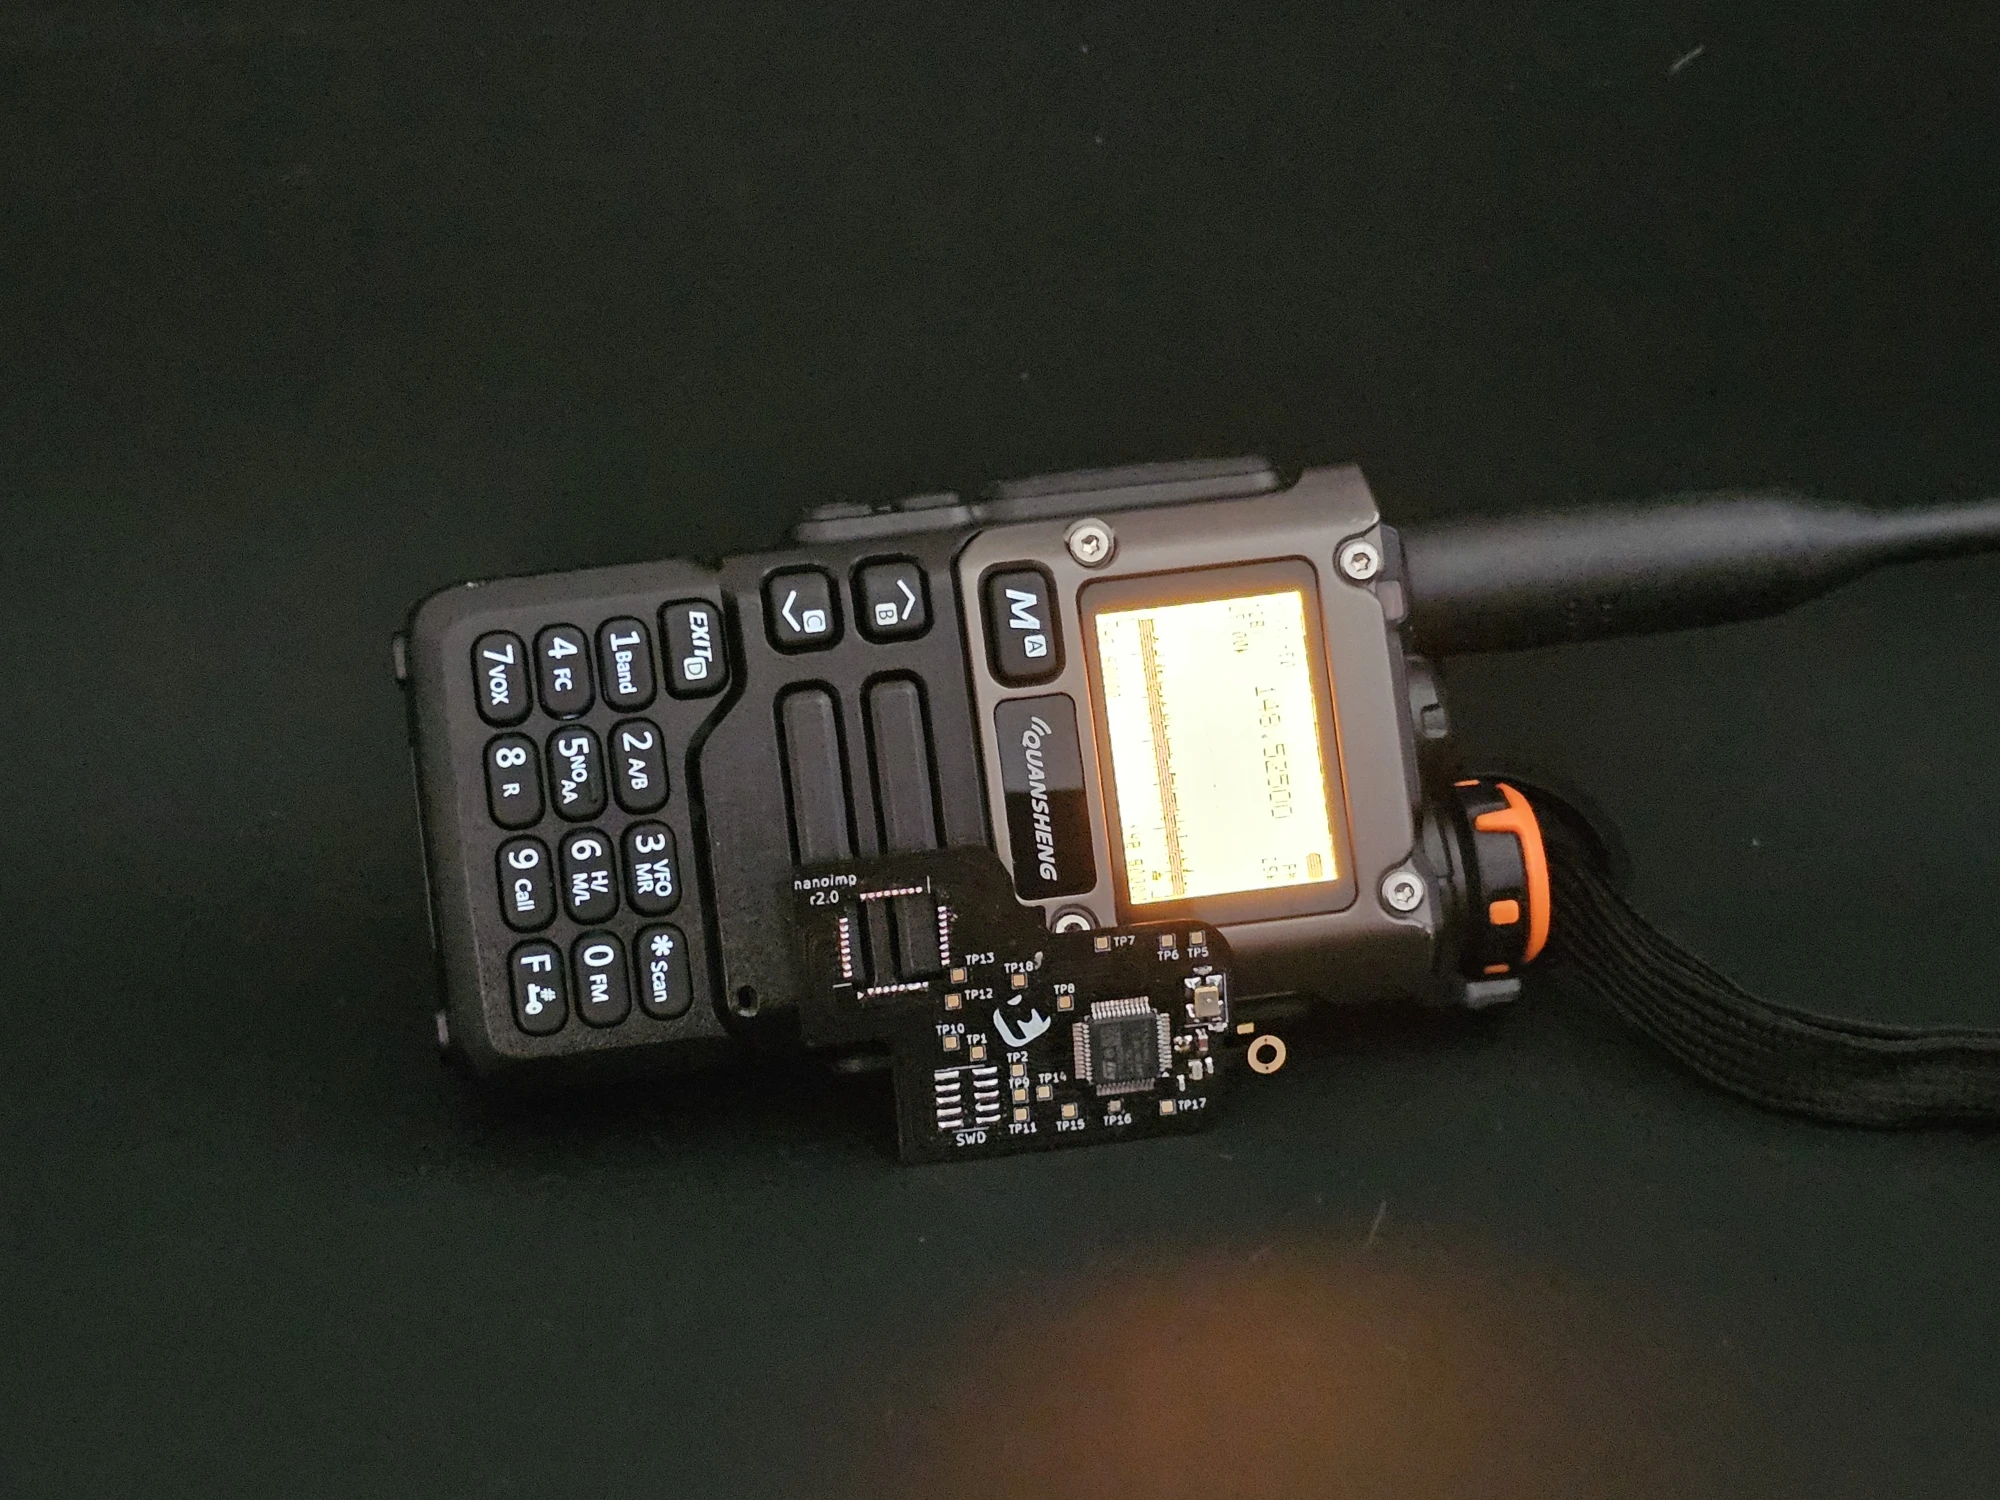
From Feature Tetris to Full Power – The UV-K5 Flex PCB Brain Hack
The Quansheng UV-K5 makes you play firmware feature Tetris with its tiny MCU. In this project, we perform some embedded brain surgery—replacing it with an STM32 via a custom flex PCB for more flash, RAM, and possibilities.
Whether you're building something new, fixing stability issues, or automating what slows your team down — we can help.