Debugging Microsecond Delays on STM32: When 1 µs Isn’t What It Seems
Why your STM32 timer-based microsecond delays may not work as you expect. Discover how Cortex-M0+ pipelines and timer register updates can affect your timing. Learn ways to correct these issues.


;TLDR
When I ported the nanoimp (UV-K5) firmware to an STM32 Cortex-M0+, the bit-banged I²C driver started to fail unexpectedly. After examining oscilloscope traces, I found that my "1 µs" delay was not what I thought it was. The problem lay in how the timer peripherals on the STM32 update their configuration and how the Cortex-M0+ pipeline adds hidden latency to tight custom delay loops. A small mistake in setting up the timer caused significant timing drift.
When a µs isn’t a µs
I was working on the nanoimp firmware, porting the bit-banged I²C driver. Then I noticed. The new driver wasn't working as expected. I fired up the debugger and connected to the controller, diving into the EEPROM's I²C chatter. Although we received and stored data in buffers, it was gibberish. The EEPROM was sending back nonsense. It didn't even store new parameters.
After some digging and debugging, I noticed the issue: the delays weren't accurate. In fact, it wasn't even close. The delay was almost instantaneous for all delay input values. Since the delay is critical for bit-banged I²C timing, it was time to investigate time itself.
Investigating the Microsecond Timer
The issue was most likely with the timer peripheral. I had verified the system clock configuration earlier. The timer code I implemented was simple, a couple of lines in length. I configured the TIM2 timer to tick every microsecond. Then I used the counter value to busy-wait for the desired duration.
Before we explore the timer source code, let’s check the STM32G0C1 clock tree. We’ll review the system clock setup. The diagram below comes from the reference manual.

The system clock SYSCLK derives from the PLL running at 64 MHz. The AHB bus clock HCLK derives from SYSCLK and runs at the same frequency. The APB bus clock PCLK prescales down to 8 MHz. Since the APB prescaler is greater than 1, the timer clock TIMPCLK runs at twice the PCLK, giving 16 MHz.
With that overview in mind, let's move on to the code. The initialization function sets up TIM2 to count upward at 1 MHz. The counter increments once every microsecond and continues up to 0xFFFFFFFF. Once configured, the timer starts immediately.
void timer_init(void)
{
    TIM2->CR1 = 0uL;

    /* The clock used for TIM is TIMPCLK which is expected to be 16MHz, double of APB clock */
    TIM2->PSC = (uint16_t)15u;

    /* Configure auto-reload register to count to the max value */
    TIM2->ARR = 0xFFFFFFFFuL;

    TIM2->CR1 |= TIM_CR1_CEN;
}
The delay function is straightforward. It captures the current timer value in microseconds. Then it busy-waits until the desired number of microseconds have passed.
void timer_usDelay(uint32_t delay)
{
    uint32_t start = TIM2->CNT;
    while ((uint32_t)(TIM2->CNT - start) < delay);
}
Simple enough, right? It should be, but for some reason, delays were not what they seemed. I needed to test the actual delay, so I decided to set up a test to verify it.
Measuring the microseconds
On the nanoimp adapter board, I had a few unused GPIO pins routed out as test points. Perfect for situations like these. I soldered a small wire to the test point as a hook and connected one of the probes from the logic analyzer.

To verify the delay's accuracy, I set up a simple test sequence:
- Step 0: Disable all interrupts and configure the test point as an output.
- Step 1: Set the test point pin high.
- Step 2: Call the delay function. Test the delay with 1, 2, 5, and 10 µs.
- Step 3: Set the test point pin low.
- Step 4: Call the delay function again with the same value. This way, we get a clean, periodic pulse signal that we can measure and analyze.
- Step 5: Repeat the test about 10 times to get an average measurement.
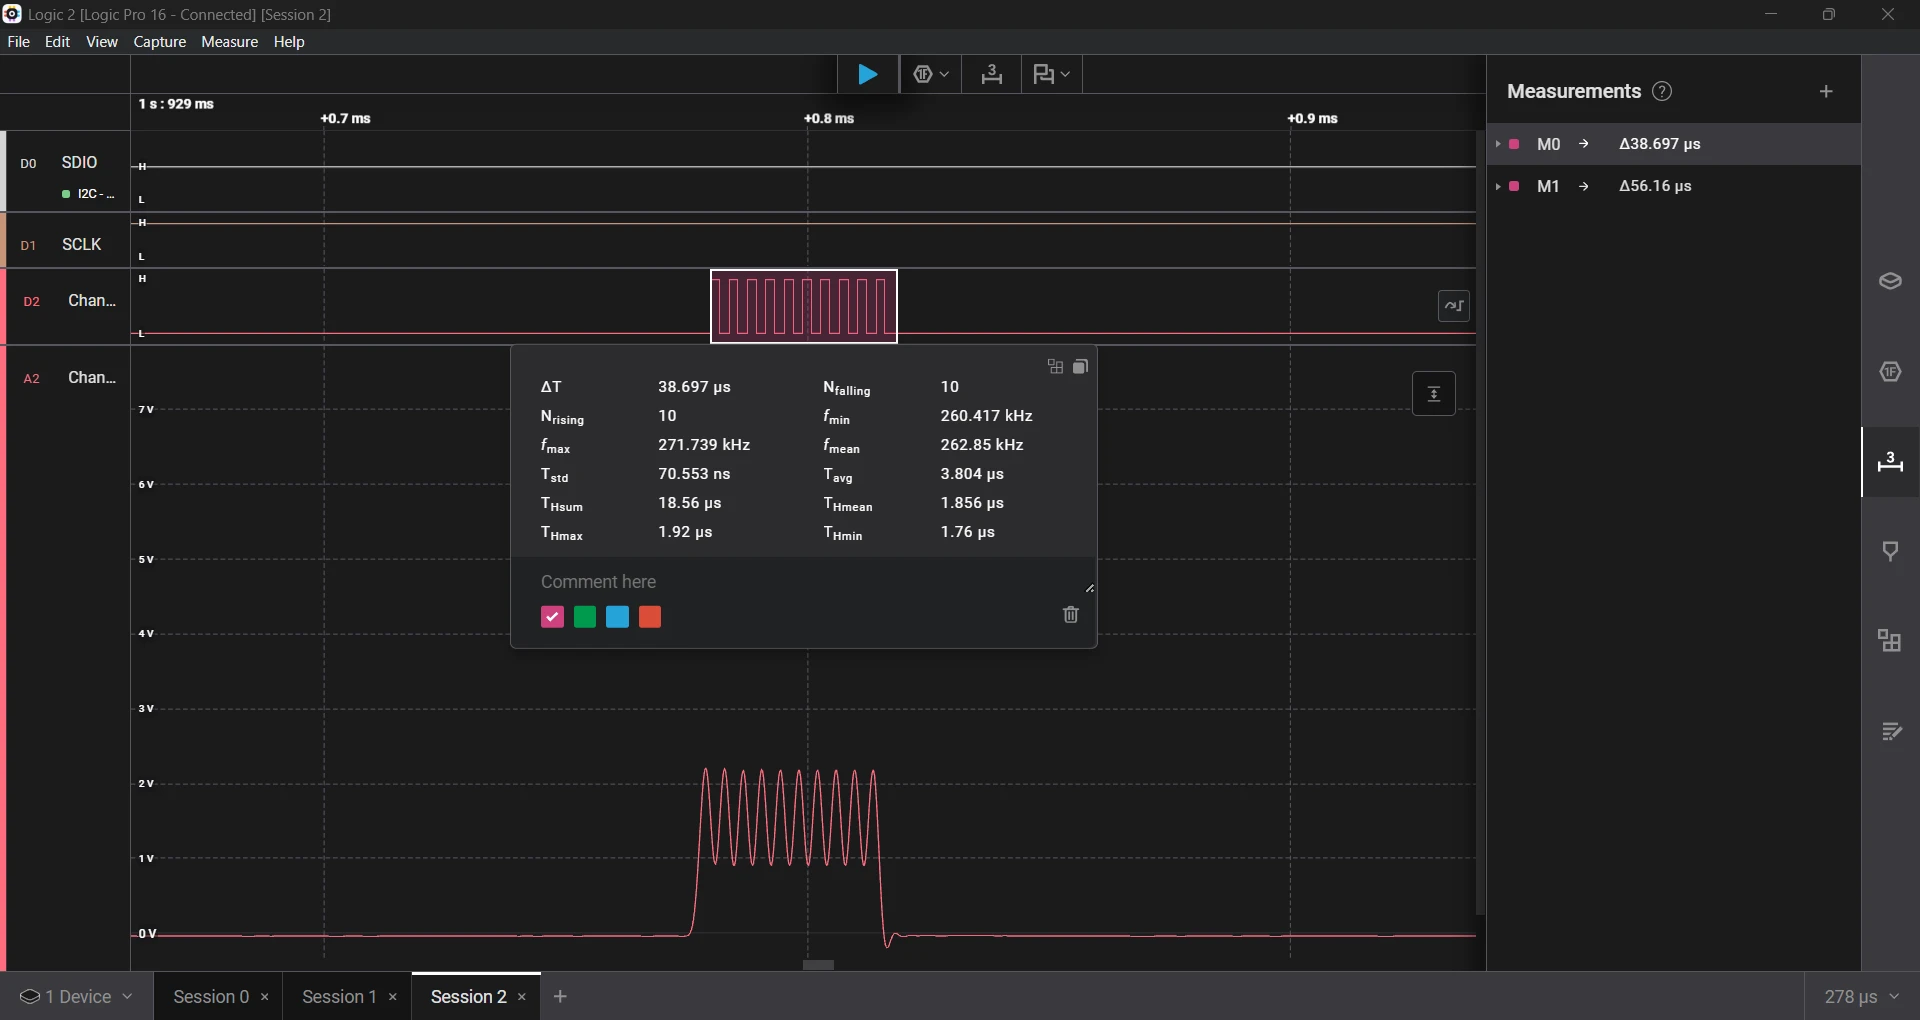
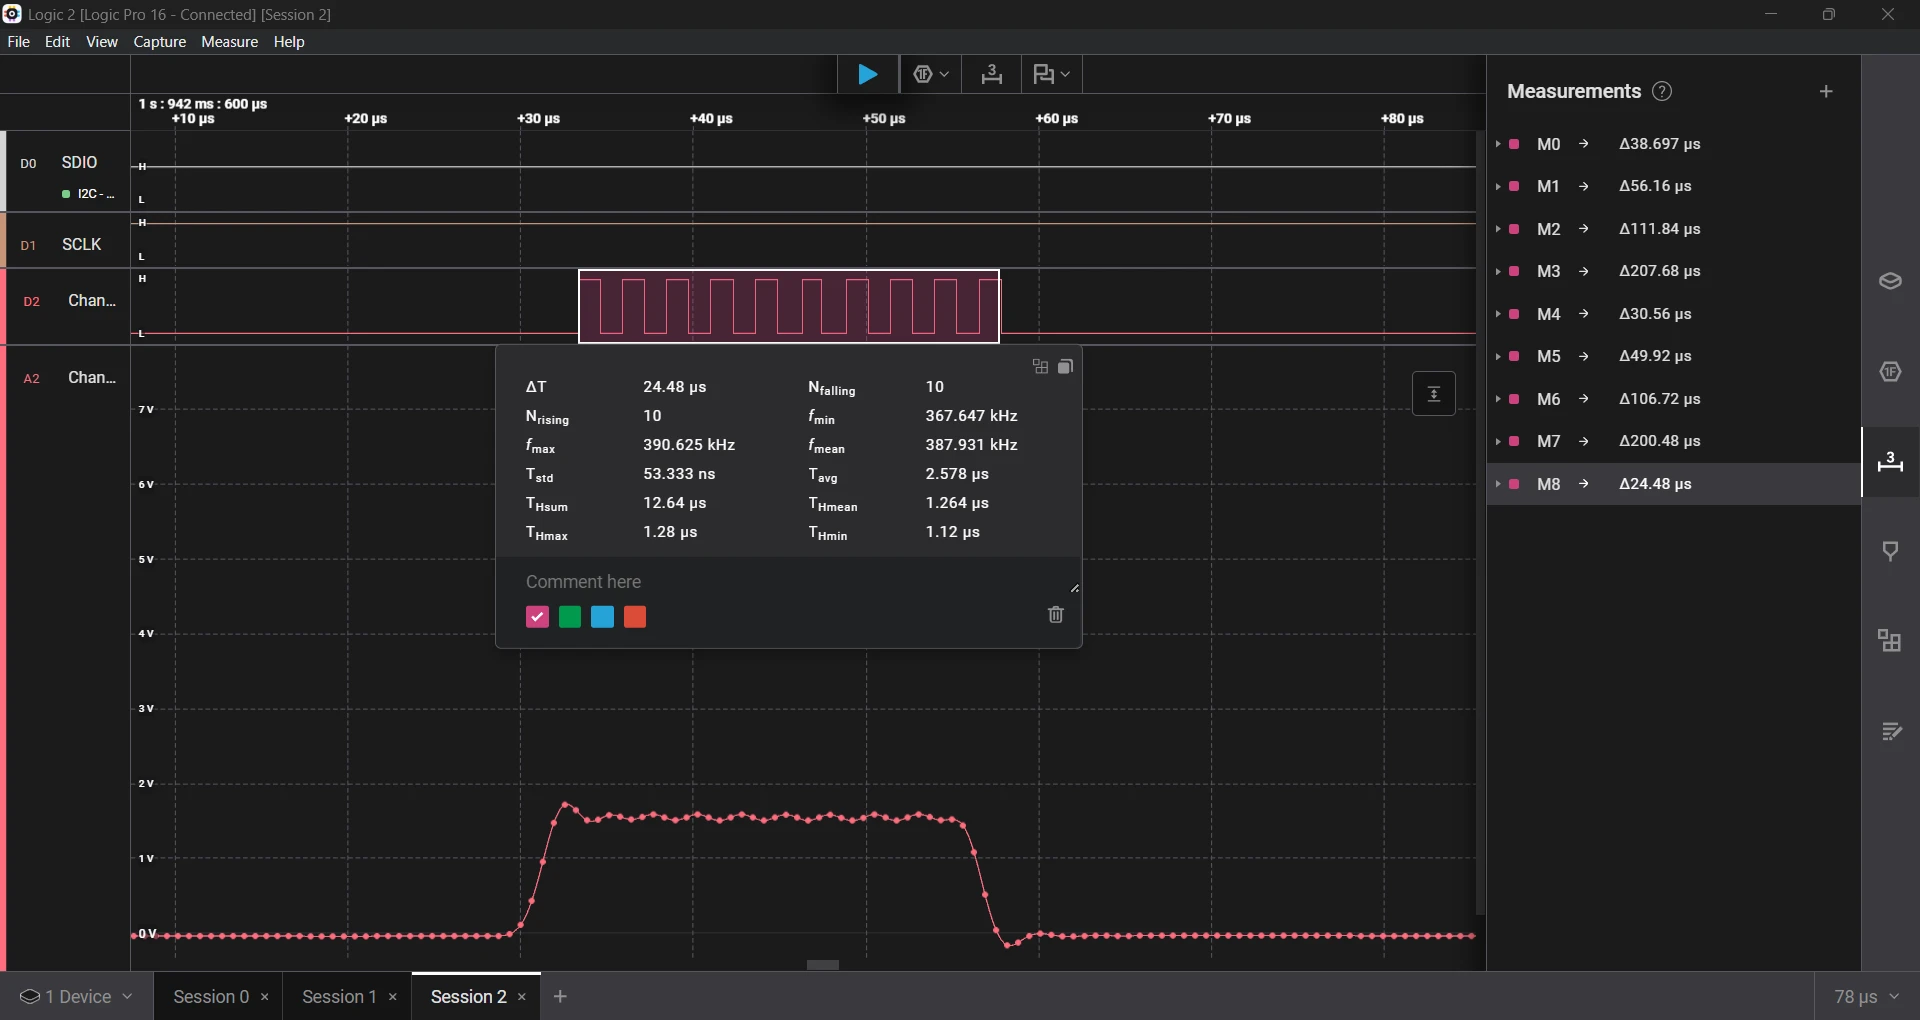
I ran the test sequence and captured the results with the Saleae Logic Analyzer. I had to install a few measurement extensions. With those, I was able to view the smallest, largest, and average delay values.

Every pulse looked almost identical. What's going on? My supposed "1, 2, 5, and 10 µs" delays all measured about the same. Something was obviously wrong.
The Rookie Mistake
After digging through the reference manual, I spotted the issue. STM32 timers don't immediately apply changes to registers. Instead, they buffer those updates until an update event (UEV) occurs. The new settings won’t take effect until the timer overflows, unless you trigger that event.
I assumed that once I enabled the timer, it would start running with the configured values. In reality, I needed to force an update before enabling it. The fix? One missing line:
/* Re-initialize the counter and generate an update of the registers */
TIM2->EGR = TIM_EGR_UG;
After adding that line and rerunning the test, the timing was much closer to what I expected. With the forced update in place, things improved, but they still weren't perfect.
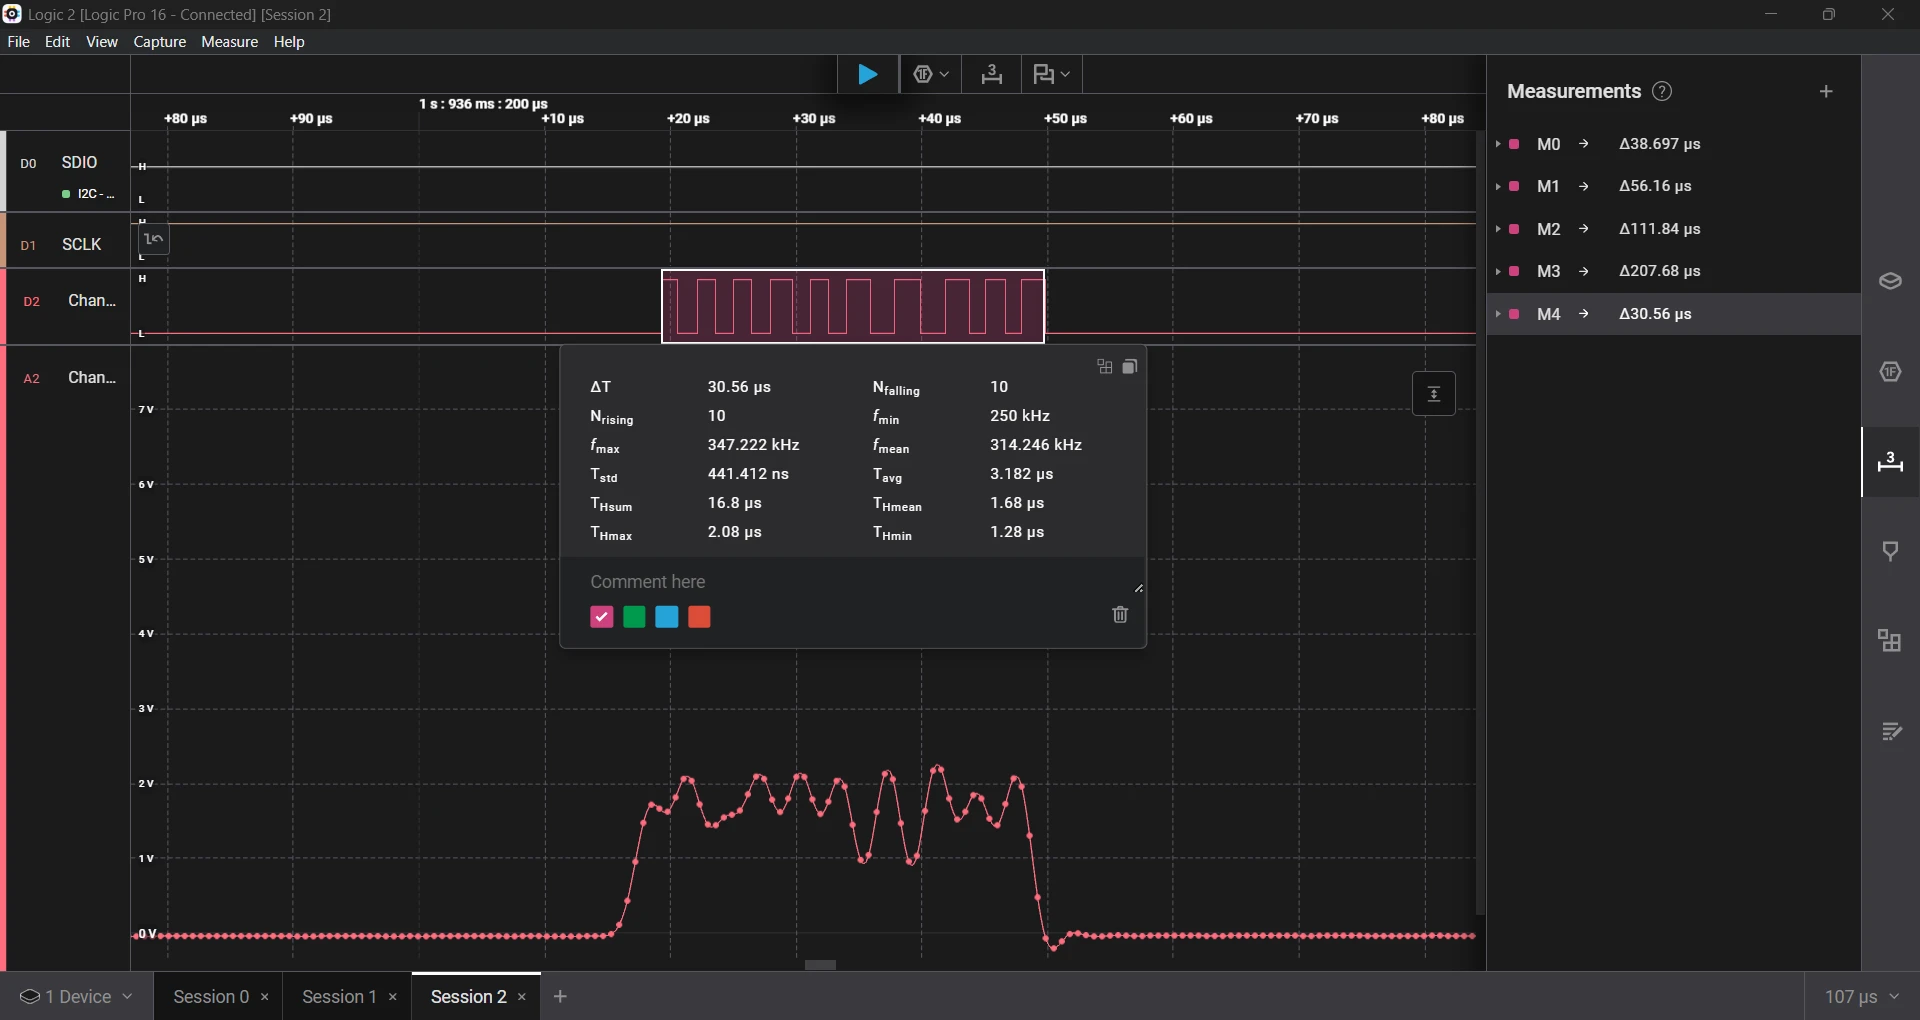
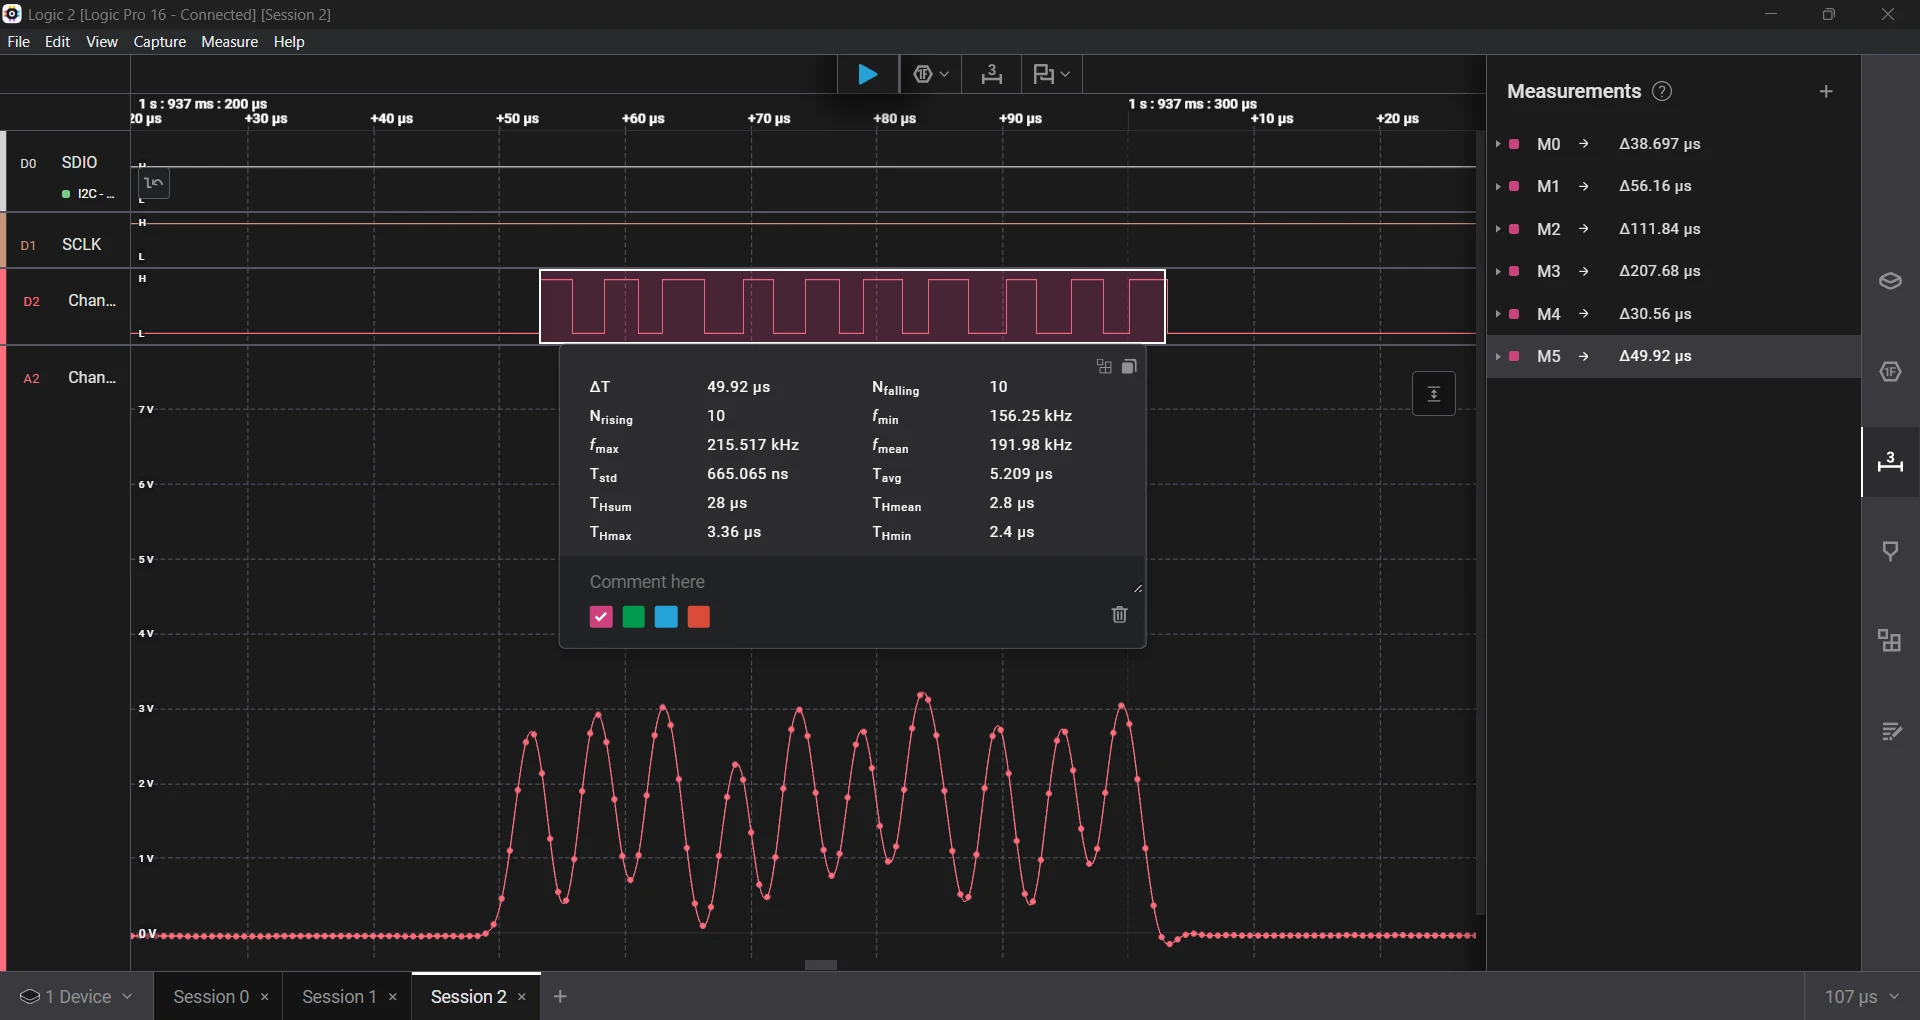
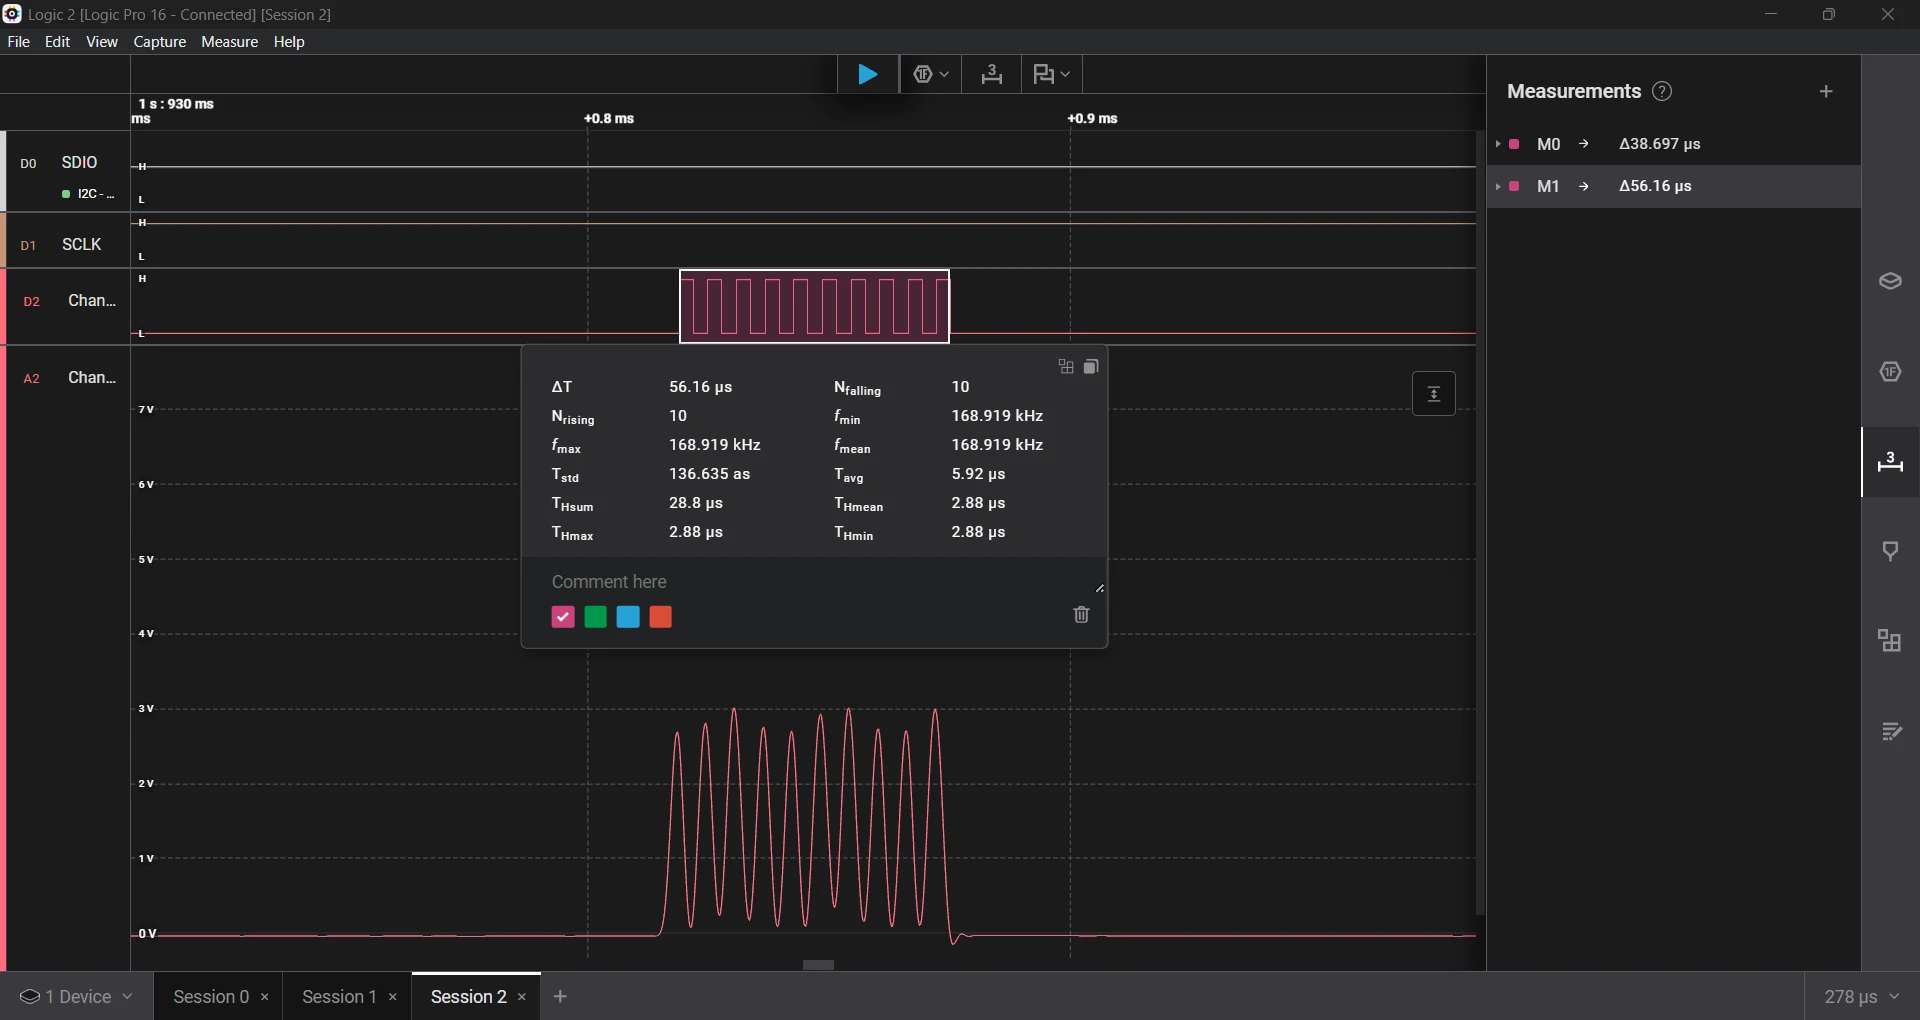
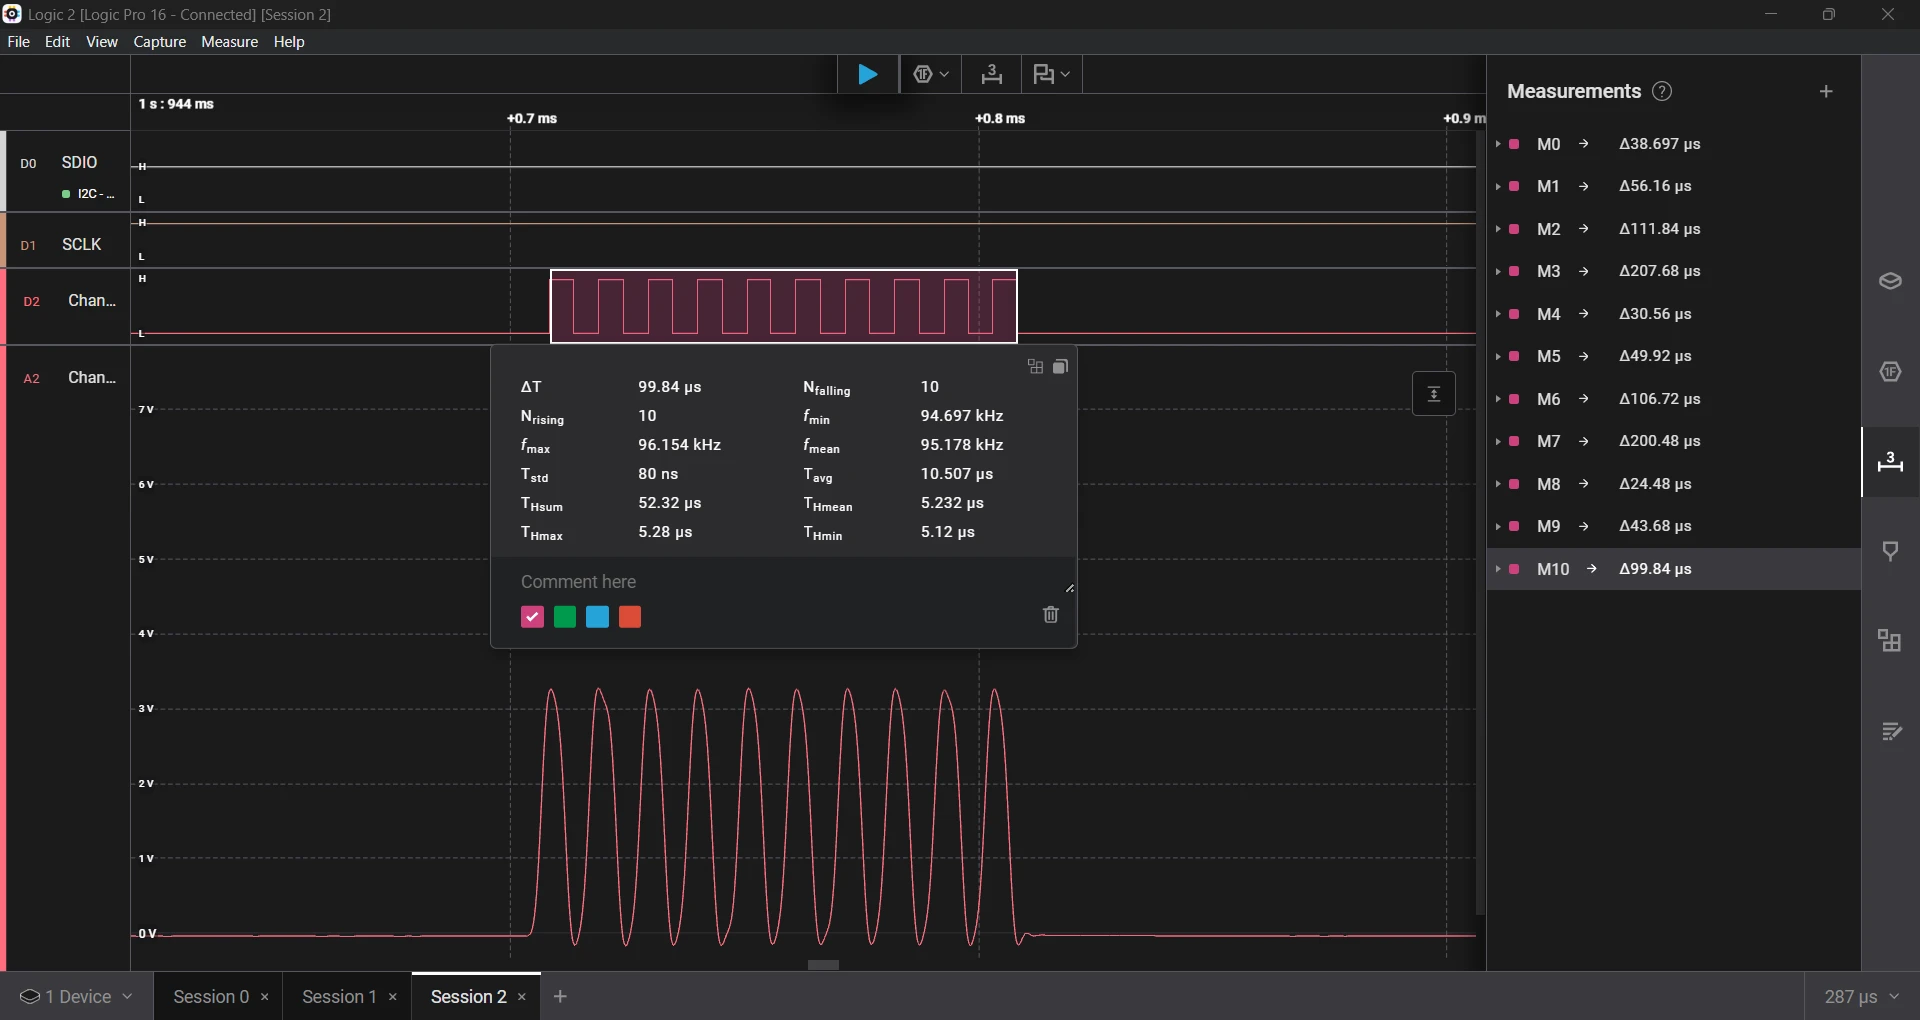
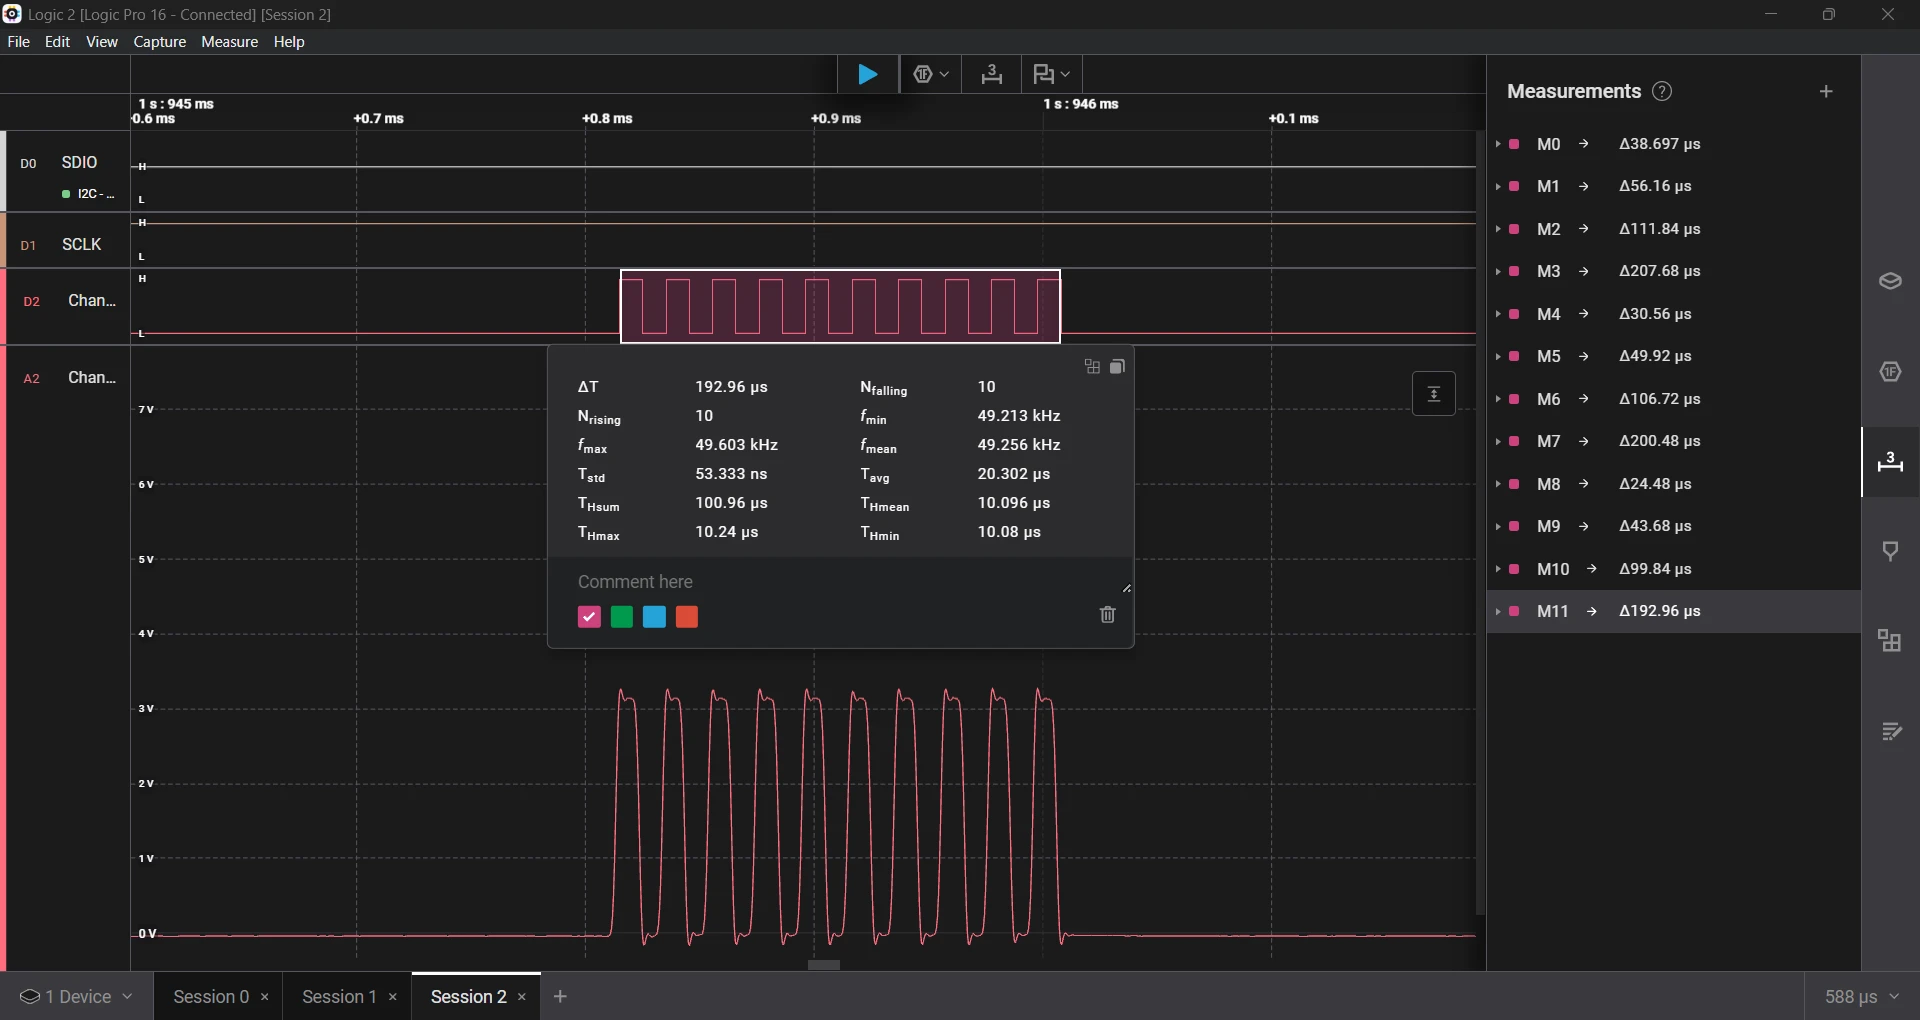
Although the time seems more in range, the error is still very high.
- Requested a 1 µs delay, which measured 1.68 µs, an error of 68%.
- Requested a 2 µs delay, which measured 2.80 µs, an error of 40%.
- Requested a 5 µs delay, which measured 5.64 µs, an error of 12.8%.
- Requested a 10 µs delay, which measured 10.38 µs, an error of 3.8%.
I compared it with a SysTick-based delay from the custom UV-K5 firmware. The pattern was the same; the shorter the delay, the higher the error. Here are the results.
Counting Time (Literally)
Let’s take a look at the disassembly of the TIM2 timer based delay function:
0800b7d0 <timer_usDelay>:
 800b7d0:	2380      	movs	r3, #128	@ 0x80
 800b7d2:	05db      	lsls	r3, r3, #23
 800b7d4:	6a5a      	ldr	r2, [r3, #36]	@ 0x24
// --- LOOP START ---
 800b7d6:	2380      	movs	r3, #128	@ 0x80
 800b7d8:	05db      	lsls	r3, r3, #23
 800b7da:	6a5b      	ldr	r3, [r3, #36]	@ 0x24
 800b7dc:	1a9b      	subs	r3, r3, r2
 800b7de:	4283      	cmp	r3, r0
 800b7e0:	d3f9      	bcc.n	800b7d6 <timer_usDelay+0x6>
// --- EXIT ---
 800b7e2:	4770      	bx	lr
At first, the assembly code seems simple. For more details on assembly instructions, check the Cortex-M0+ Devices Generic User Guide. If we count the cycles per instruction, the while loop itself should take roughly 8 cycles. At a core clock of 64 MHz, each loop takes about 125 ns. The delay should be accurate, with just a bit of overhead from function calls. Yet the actual results show significant error.
So what's happening? Several hidden factors come into play:
- Function call/return overhead. Every register push or pop adds a cycle. Even small functions can gather several cycles in overhead.
- Pipeline refill after branching. The Cortex-M0+ has a 2-stage pipeline. It splits instruction processing into two steps: fetch and execute. Fetch grabs the next instruction from memory. Execute decodes and runs it. This overlap makes the process more efficient. Each branch or pipeline flush adds extra cycles as the core refills instructions.
- Flash wait states. At 64 MHz, we need two flash wait states. This means each instruction fetch can add up to two extra cycles. Although predicting this is hard since prefetching might affect it.
- Peripheral synchronization delays. The PCLK for TIM2 runs at 8 MHz, while the core runs at 64 MHz. Reading peripheral registers requires synchronization across these domains. This adds roughly 250 ns per read (two PCLK cycles at 125 ns each).
All these effects add up to hundreds of extra nanoseconds. At the microsecond scale, that overhead dominates. We can expect an extra delay of 300 to 400 nanoseconds.
Building a Better Delay (By Hand)
Inlining the delay function could help a little, but it bloats the code. I wanted something compact and accurate, so I turned to handwritten assembly. By counting instruction cycles. We can craft a loop that burns a precise number of cycles per iteration.
Here's an example of a delay loop placed in RAM (to cut flash wait states):
__attribute__ ((section (".ram"))) void timer_usDelayShort(uint32_t delay)
{
    (void)(delay);

    __asm (
        ".thumb_func      \n"
        "mydelay:         \n"
        " mov  r1, #20    \n" // 1 cycle
        "mydelay1:        \n"
        " sub  r1, r1, #1 \n" // 1 cycle
        " bne  mydelay1   \n" // 2 if taken, 1 otherwise
        " sub  r0, r0, #1 \n" // 1 cycle
        " bne  mydelay    \n" // 2 if taken, 1 otherwise
    );
}
This crafted assembly function uses two nested loops:
- The inner loop (
mydelay1) burns roughly 1 µs. - The outer loop (
mydelay) repeats the inner loop for the requested delay count.
The inner loop runs 20 iterations (mov r1, #20). Each iteration takes 3 cycles when the branch is taken and 2 cycles on the final pass, giving a total of 19 × 3 + 2 = 59 cycles. Add a few extra cycles for the outer loop and we end up with roughly 62 cycles per microsecond. Almost a perfect 1 µs at 64 MHz.
We've eliminated FLASH wait states, peripheral bus synchronization delays, and APB read penalties. Only function call overhead and pipeline effects remain.
Now, lets perform the test sequence again and see how the assembly function performs.
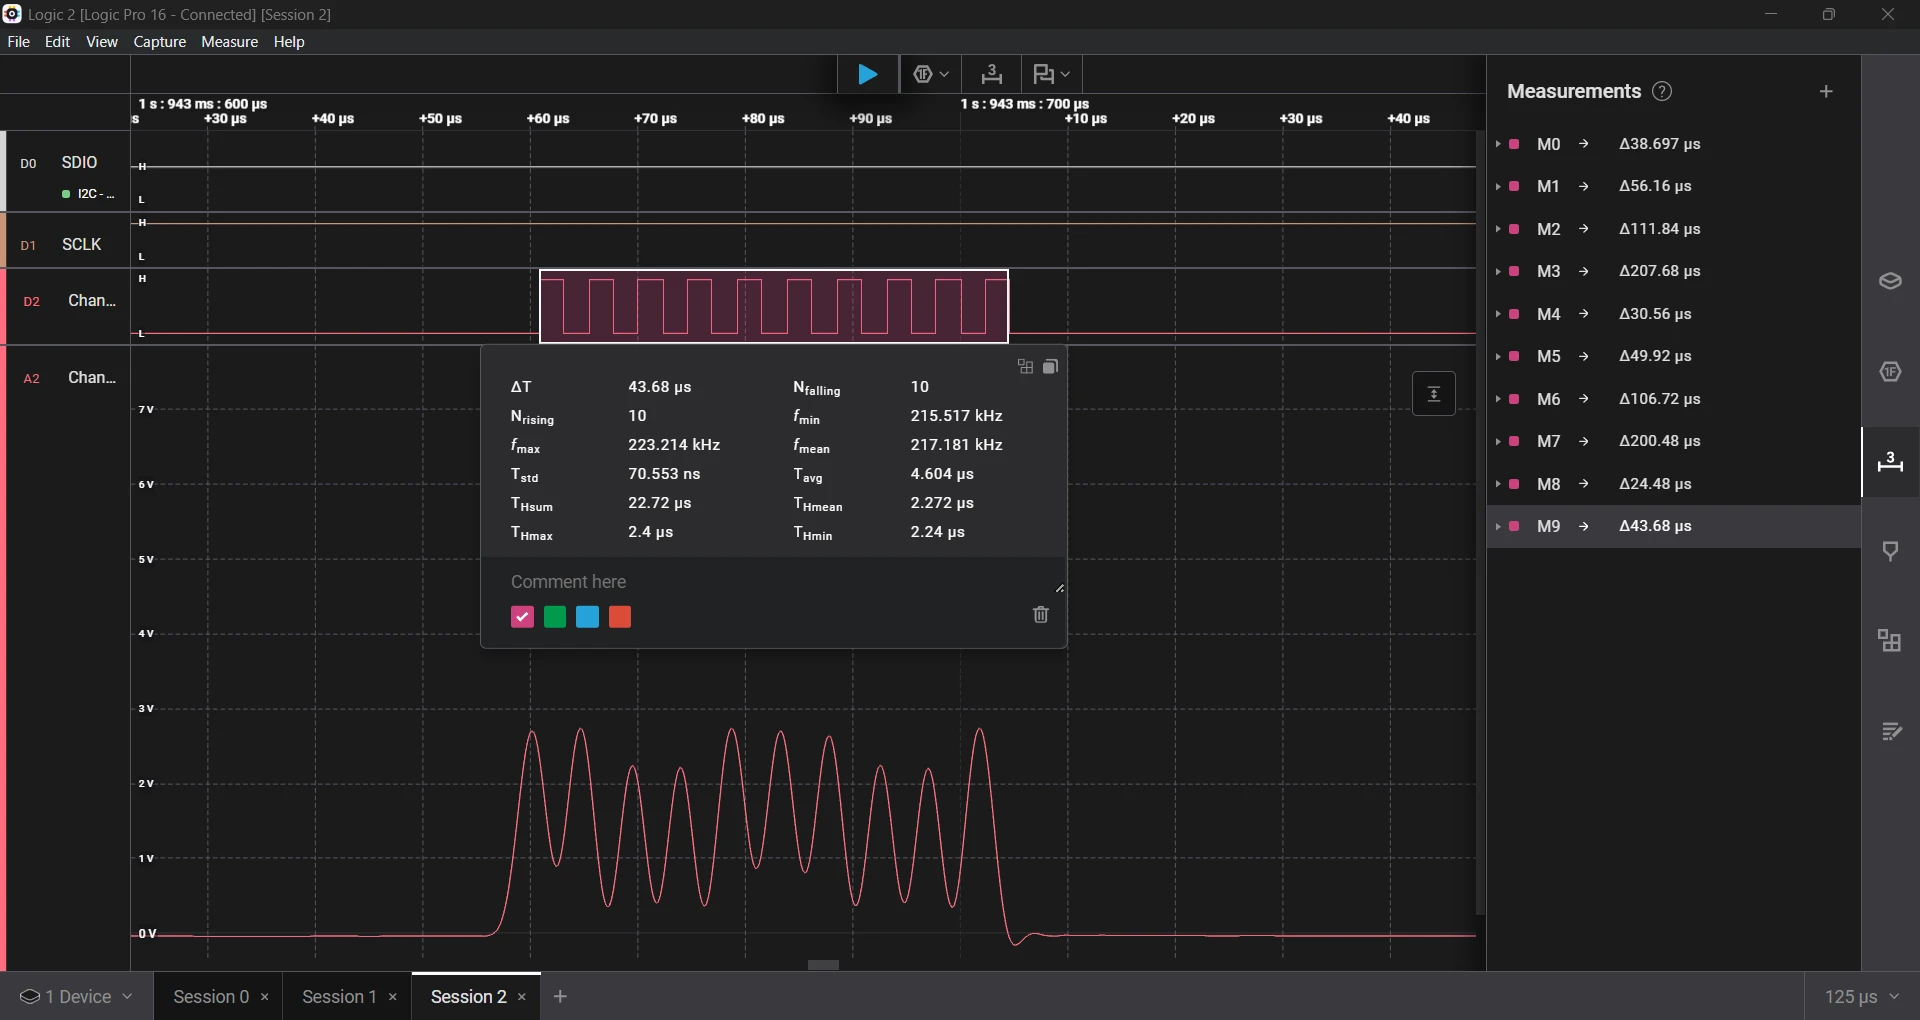
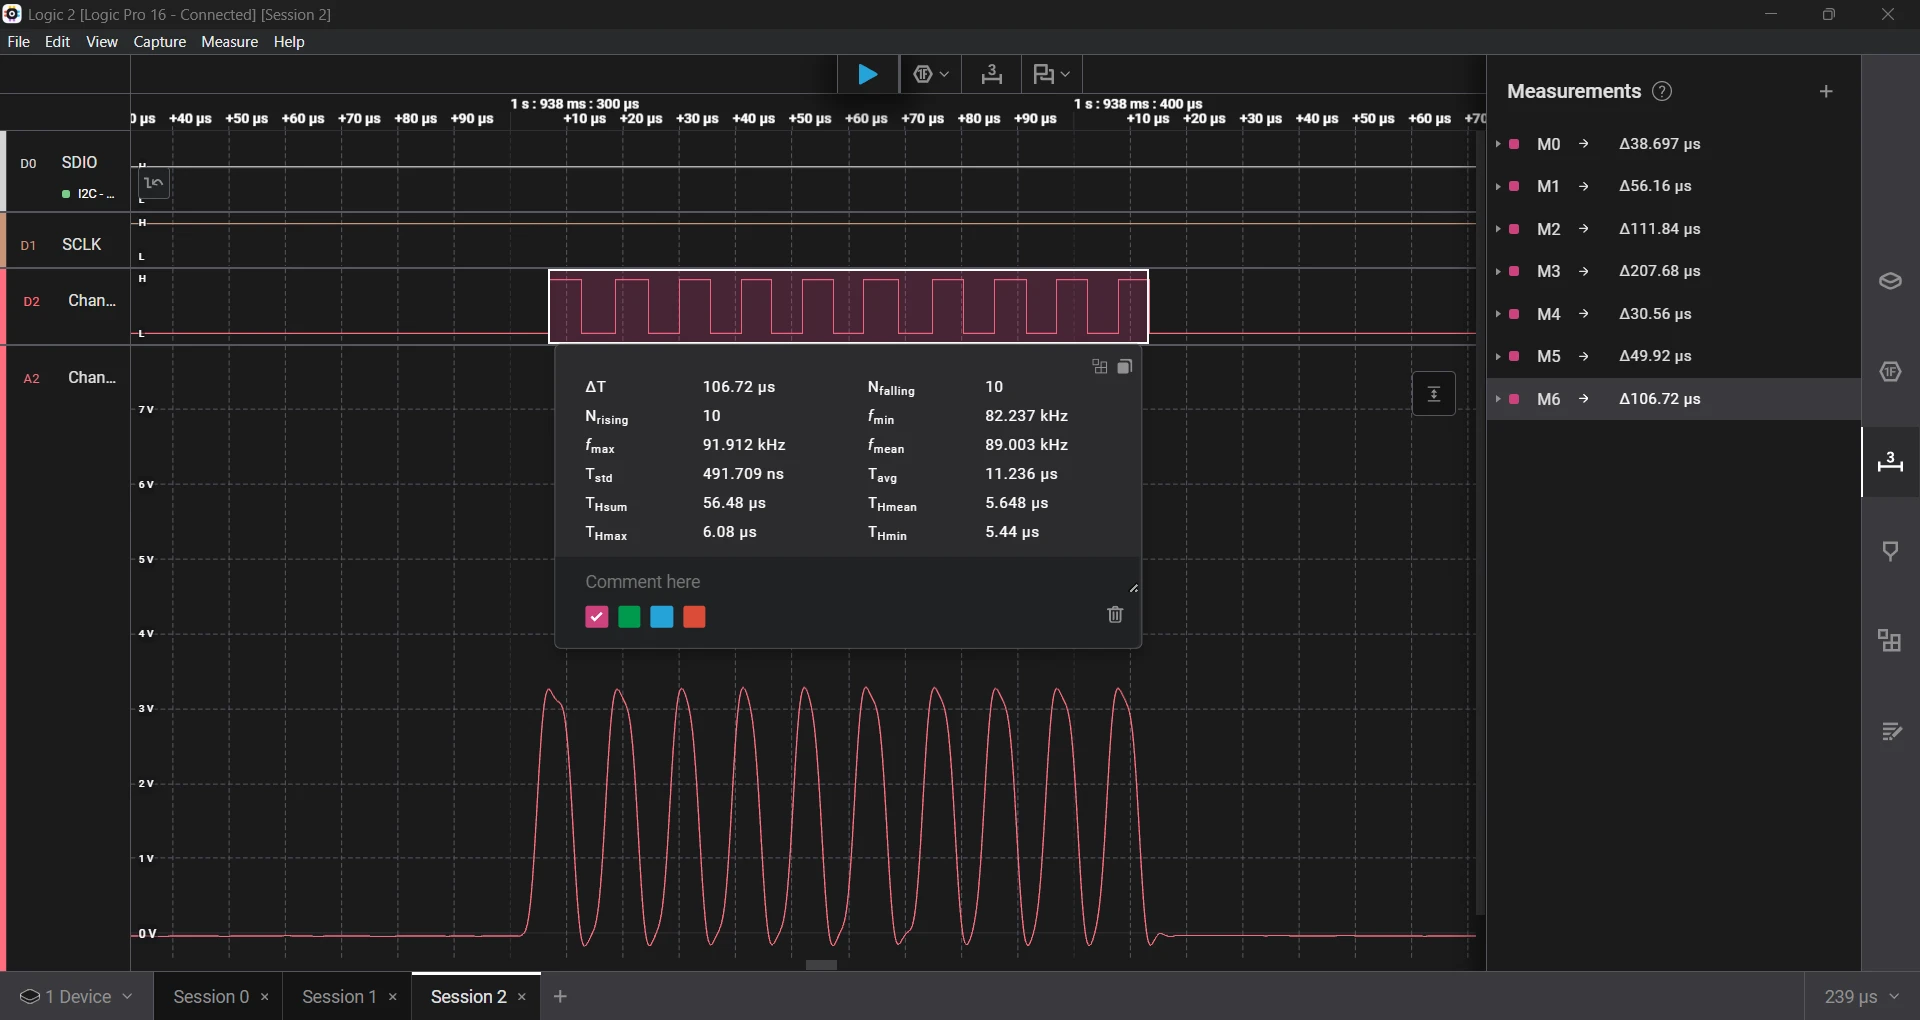
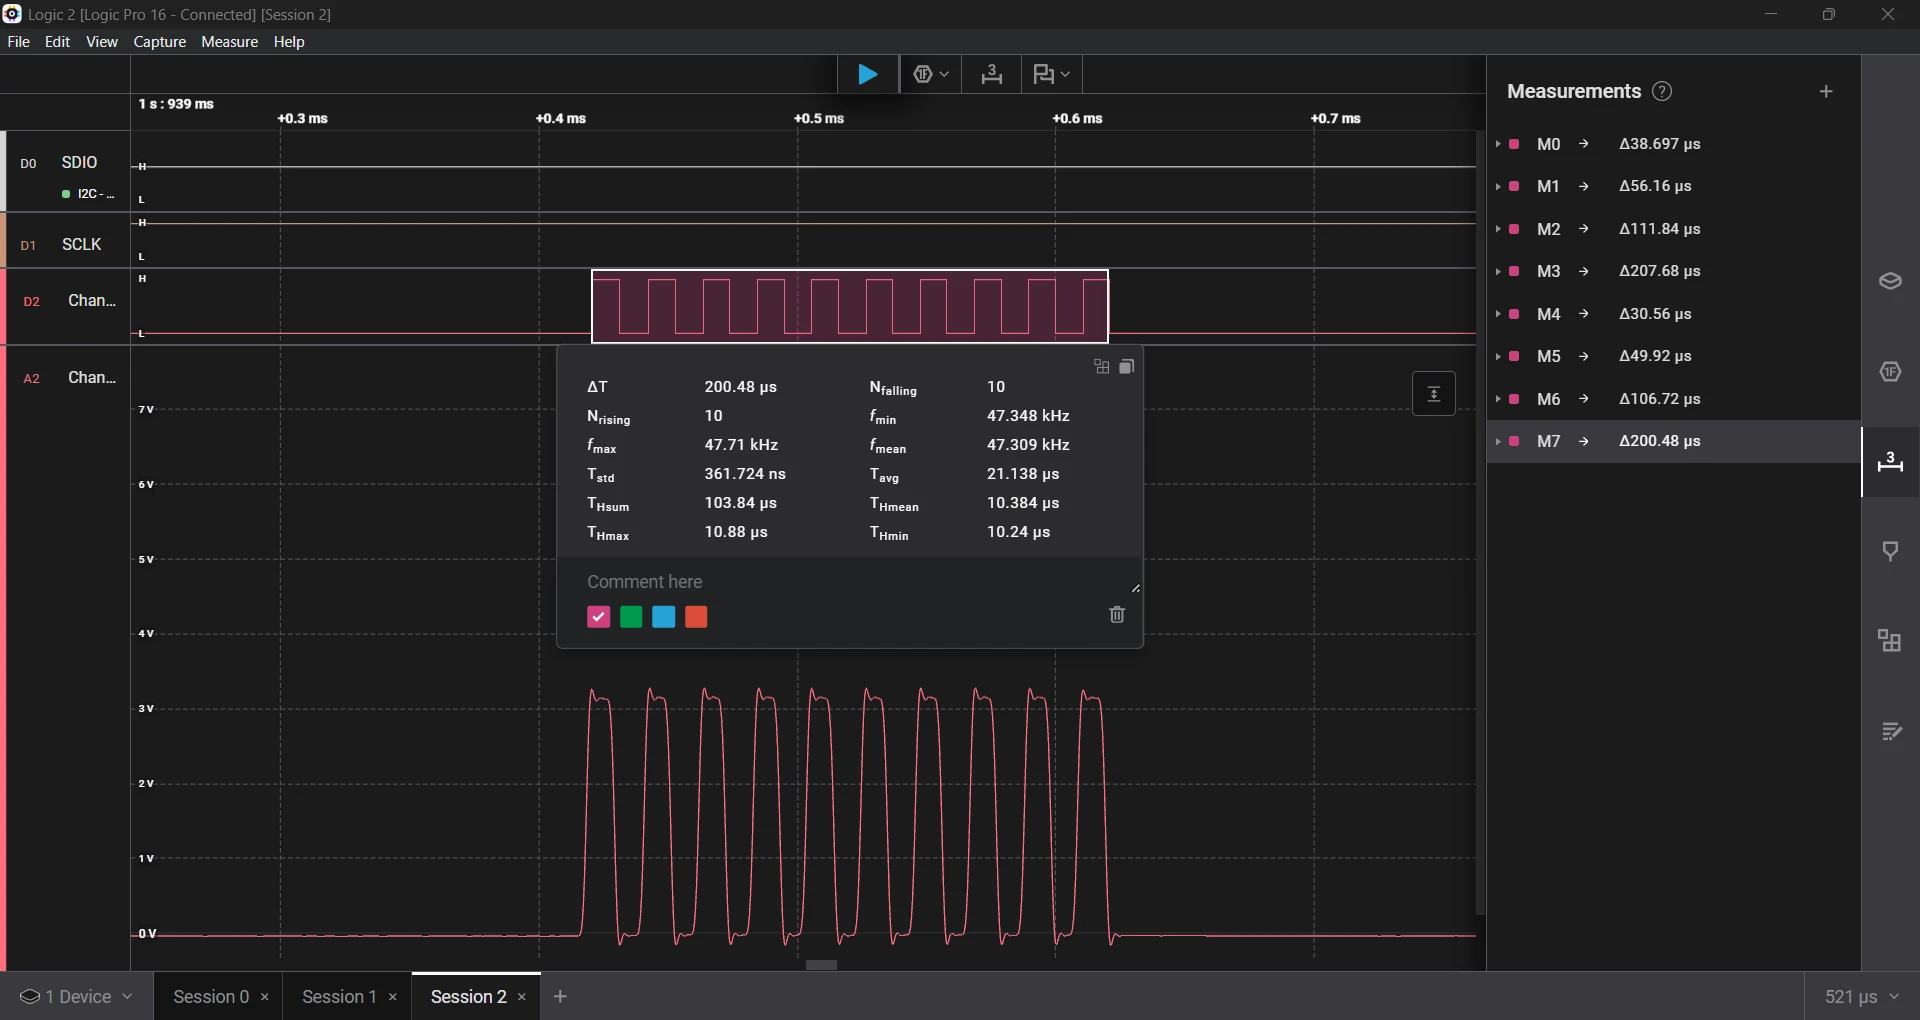
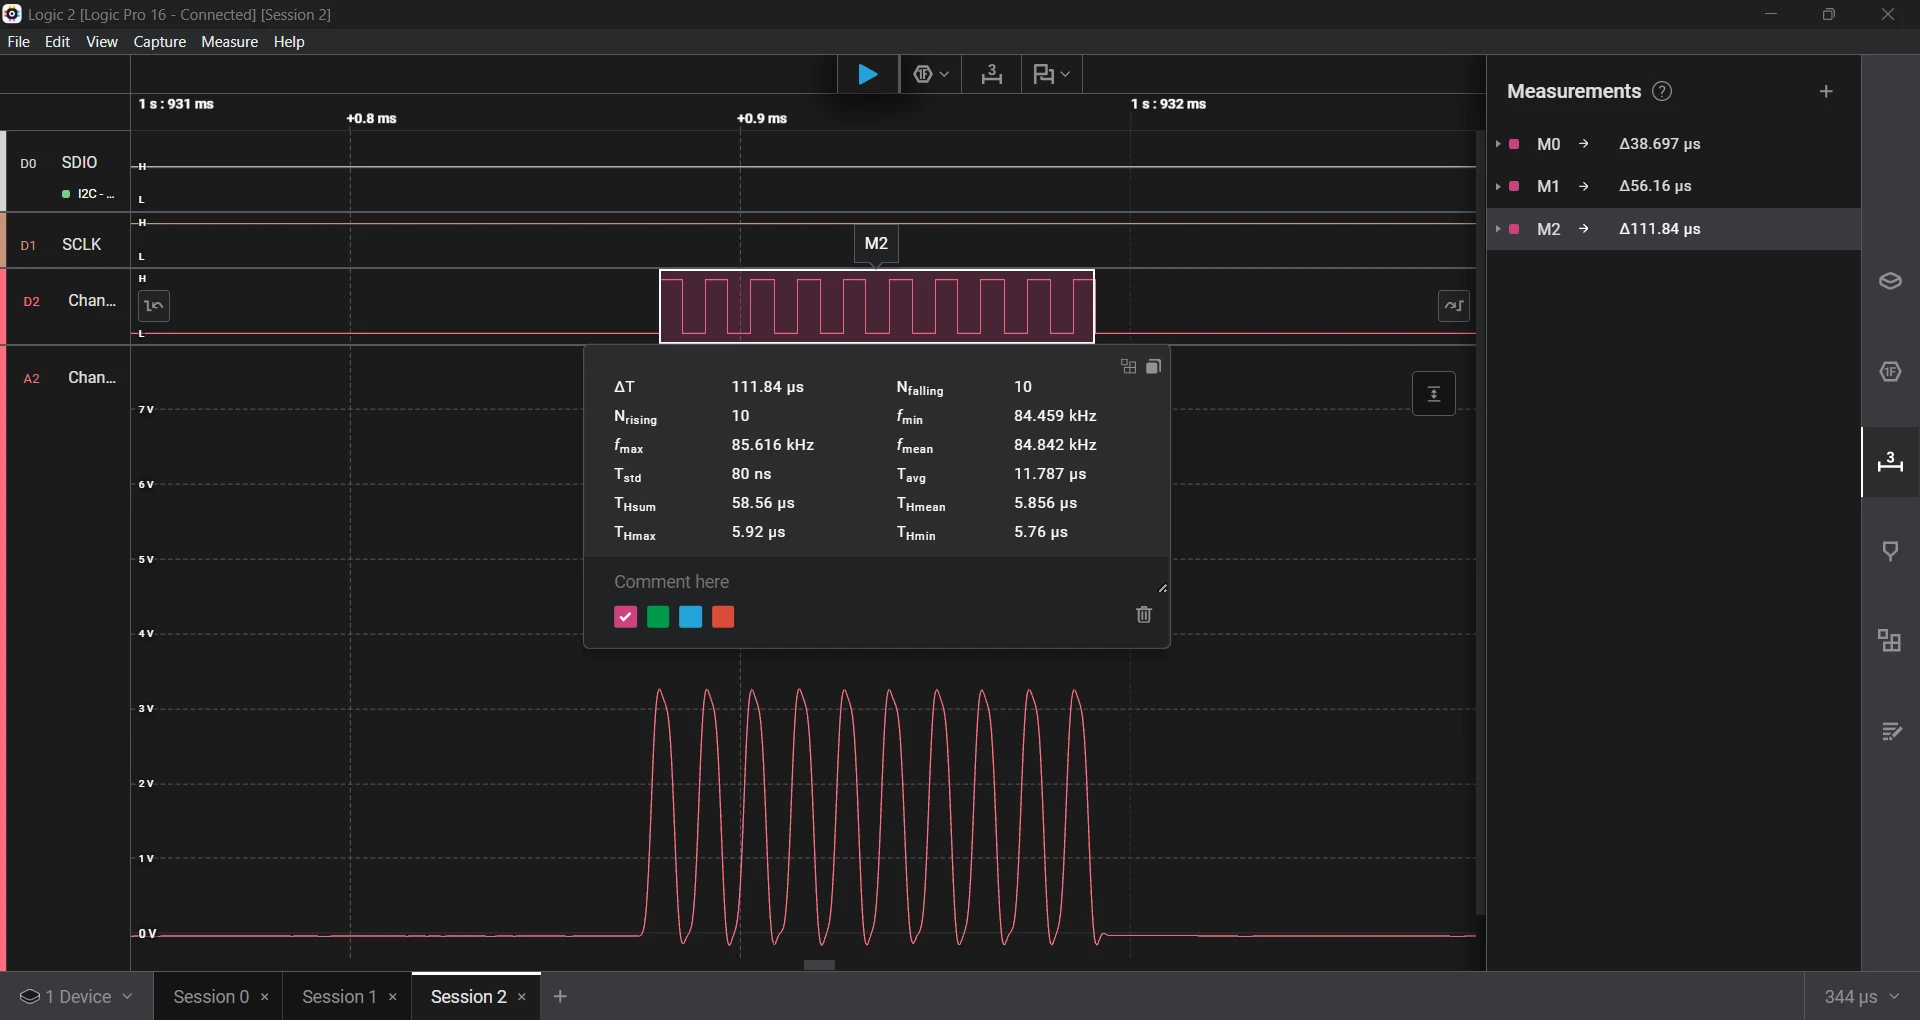
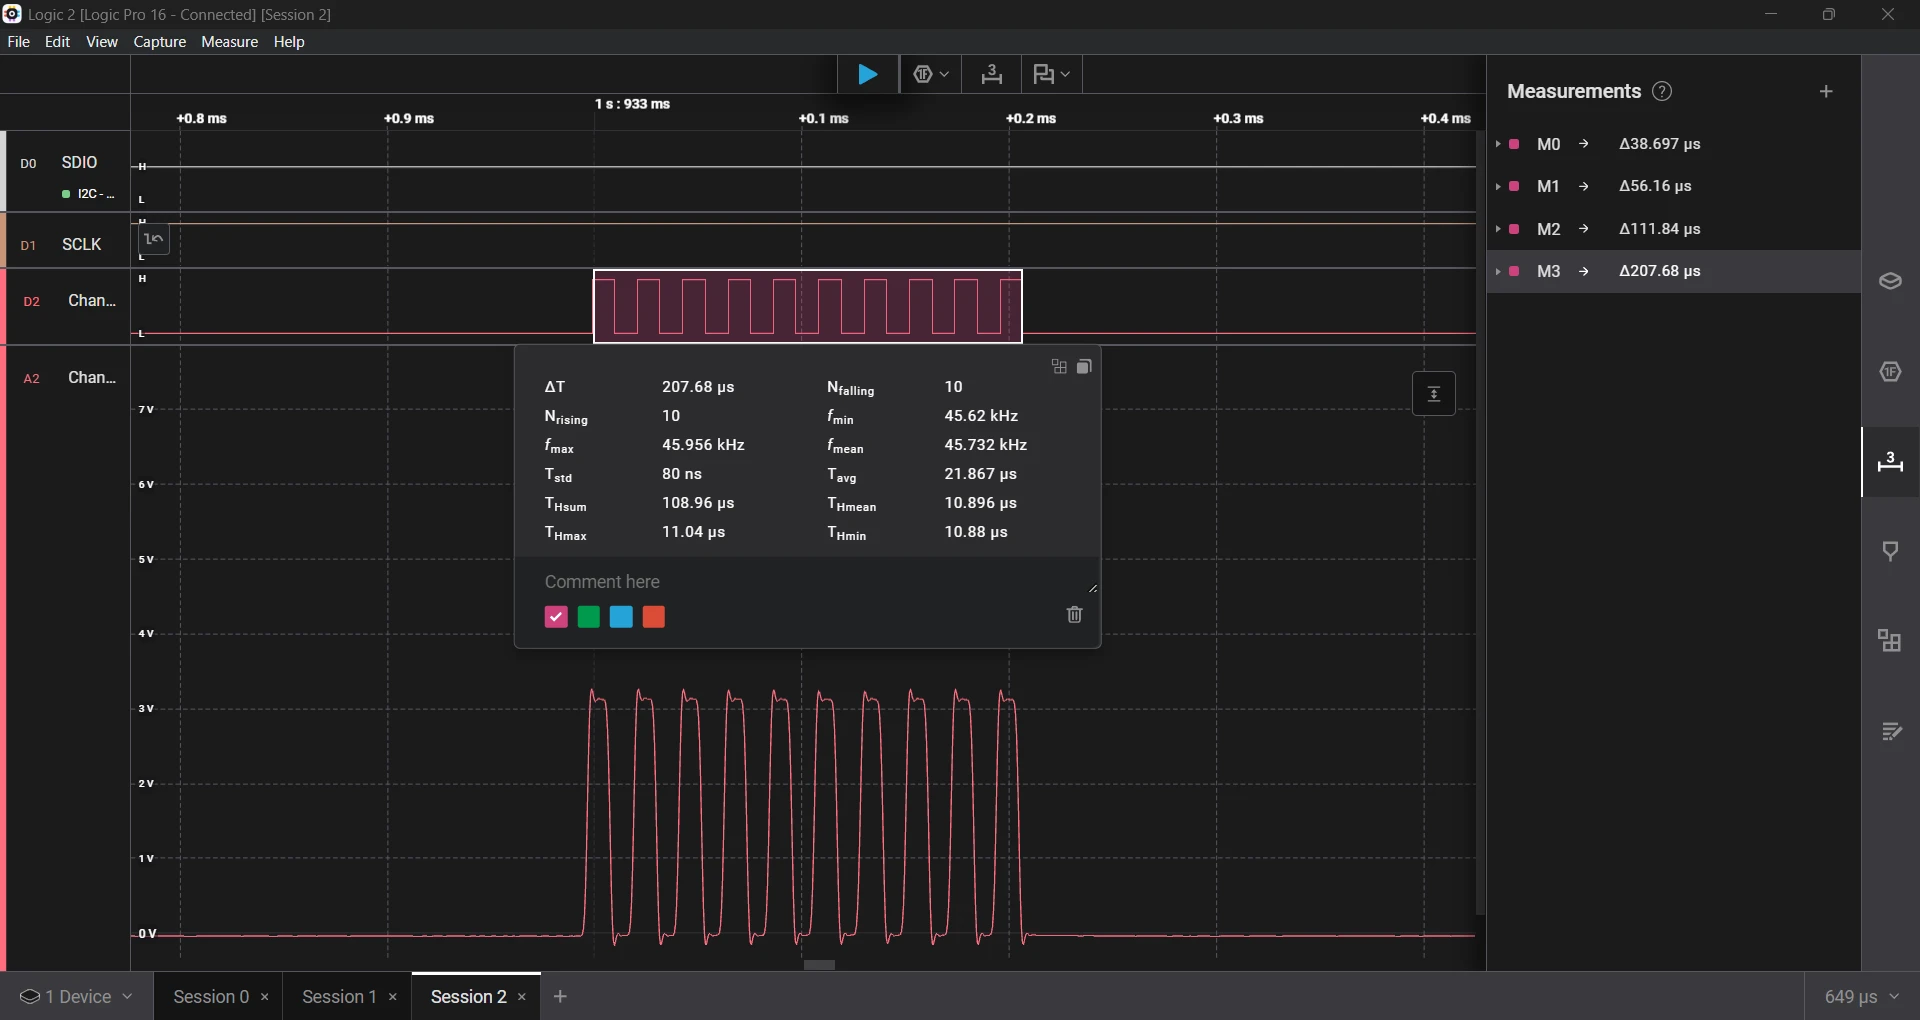
Running the same test again improved accuracy by 2× to 3× over earlier versions.
- Requested a 1 µs delay, which measured 1.26 µs, an error of 26%.
- Requested a 2 µs delay, which measured 2.27 µs, an error of 13.5%.
- Requested a 5 µs delay, which measured 5.23 µs, an error of 4.6%.
- Requested a 10 µs delay, which measured 10.09 µs, an error of 0.09%.
We still have about 26% error at 1 µs. If we fine-tune the loop constants, we could achieve precise short delays. All in all, it's quite an improvement!
Finally, let's replace the original delay with an improved "turbo" one and get some well-deserved speed-up and stability...

....and I²C stopped working. The delay worked well, too well. It made the timing so precise that the I²C bit-banging ran faster than the device could keep up with.
Lessons Learned
Timing on microcontrollers is deceptive. Even a delay loop that appears bulletproof can betray you when you:
- Forget to trigger a timer register update.
- Ignore instruction pipeline effects.
- Assume your code execution time is negligible.
When dealing with sub-microsecond precision, the only safe way is to measure everything. Don't assume! Accurate timing on microcontrollers isn't about the math. It's about understanding what the hardware actually does between each instruction.
Liked this post? You might also enjoy Cortex-M0 Profiling: How to Trace Without Hardware Support

Secure Your DNS Traffic: Implementing DNS over TLS with Unbound
Tired of exposing your DNS queries in plaintext? Learn how to set up DNS over TLS (DoT) with Unbound to encrypt your traffic, verify the setup, and block bypass attempts with hands-on examples and packet analysis.

Advanced RTT in Embedded Rust: A Guide to Multi-Channel Logging and Binary Streaming (Part 2)
Stream RP2040 sensor data over RTT and decode logs in real time. Use Python to visualize binary temperature readings and turn raw bytes into insights.

Advanced RTT in Embedded Rust: A Guide to Multi-Channel Logging and Binary Streaming (Part 1)
Learn to set up multi-channel RTT on the Pi Pico: structured logging with defmt, debug prints, and host commands—all over a single SWD/JTAG probe.
Whether you're building something new, fixing stability issues, or automating what slows your team down — we can help.