Cortex-M0 Profiling: How to Trace Without Hardware Support
The ARM Cortex-M0 and M0+ lack hardware tracing features like SWO, ETM, and ITM, so how do you profile code on them? In this post, I explore software-based techniques to get deeper insight into performance and debugging on these resource-constrained MCUs.

I’ve been exploring tracing and debugging options for the ARM Cortex-M0 and M0+. My goal was to improve my usual debug setup, but these little chips don’t make it easy as they don’t come with the SWO, ETM, or ITM support. That meant I had to look into software-based solutions.
Trying Out Function Wrappers
One of the first things I found was the compiler option -finstrument-functions. This flag automatically inserts hooks at the entry and exit of every function. The compiler expects you to provide handlers like these:
void __cyg_profile_func_enter(void *this_fn, void *call_site);
void __cyg_profile_func_exit(void *this_fn, void *call_site);
The tricky part is avoiding recursion, you need to mark them (and anything they call) with the no_instrument_function attribute. Otherwise, the compiler instruments the handlers too, and your stack quickly implodes. Here’s an example of how the hooks could be implemented using RTT and with the required attributes.
__attribute__((no_instrument_function))
void __cyg_profile_func_enter(void *this_fn, void *call_site) {
    SEGGER_RTT_printf(0, "ENTER: %p <- %p\n", this_fn, call_site);
}

__attribute__((no_instrument_function))
void __cyg_profile_func_exit(void *this_fn, void *call_site) {
    SEGGER_RTT_printf(0, "EXIT : %p <- %p\n", this_fn, call_site);
}
Now I was ready to build my test blink program, the compiler option added to my project options, the hooks implemented. I encountered some problems with inline functions, global inline functions to be precise. The -finstrument-functions compiler flag will try to add these enter and exit hooks to all functions in your project. This means all the low level code as well. Ideally I would have liked to mark functions to be instrumented rather than exclude them, but that’s not how that options works. No matter what I tried, I couldn’t get it to build cleanly.
That’s when I discovered something new: GCC plugins. Unlike the built-in option that instruments everything, a community plugin from Github lets you tag only the functions you want to be wrapped. Excellent! Similarly to the built in option, you need to add a specific attribute to the function. In this case instrument_function.
void __attribute__((instrument_function)) instrumented_function() {
  // This is instrumented
}
So far so good. Next I wanted to compile the blinky program without the instrument-functions compile option, but with the new plugin enabled. To add the plugin I first needed to compile it. On Windows, getting required GCC dev package is not that straightforward, so I switched over to my Linux machine and tried to build it there ... and ... gosh the GCC version I have has a newer plugin API and it wouldn't compile. I could patch the plugin source to make it work with the new GCC plugin API, but further research revealed that arm-none-eabi-gcc is built without plugin support on Windows. Even if I could get it running on Linux, I couldn't use it cross platform...

Selective Instrumentation
I was so fixated on using the trace wrapper in a certain way that I did not consider the alternatives. Adding the instrument-functions compile option to the whole project does not work, too many issues and possibilities for things to go wrong, but what if we just add the option to one file we care about? With CMake, this is super easy:
set_source_files_properties(blink.c PROPERTIES COMPILE_FLAGS "-finstrument-functions")That line tells the build system to apply the instrumentation flag only to blink.c. And just like that BAMM! it compiled cleanly.
[build]  [  2%] Built target bs2_default
[build]  [  7%] Built target bs2_default_library
[build]  [  7%] Building C object blink/CMakeFiles/blink.dir/blink.c.obj
[build]  [  9%] Linking CXX executable blink.elf
[build]  [100%] Built target blink
[driver] Build completed: 00:00:05.392
Now, let’s check the disassembly of a simple instrumented report_some_numbers function to see what’s happening under the hood.
1000033c <report_some_numbers>:
1000033c: b510       push {r4, lr}
1000033e: 4674       mov r4, lr
10000340: 4814       ldr r0, [pc, #80] @ (10000394 <report_some_numbers+0x58>)
10000342: 4671       mov r1, lr
10000344: f7ff ffc6  bl 100002d4 <__cyg_profile_func_enter>
Here we can clearly see the compiler has inserted a call to __cyg_profile_func_enter. The lines above are just the function prologue, but that final bl is our wrapper hook.
For logging, I used SEGGER RTT to capture the output from the enter/exit hooks. Flashing and running the program produced a log like this:
ENTER: 1000033D <- 100003DF
ENTER: 10000305 <- 10000361
EXIT : 10000305 <- 10000361
EXIT : 1000033D <- 100003D
Those numbers are just raw addresses, but we can map them back to actual source lines using arm-none-eabi-addr2line
arm-none-eabi-addr2line.exe -e blink.elf 0x1000033DOnce decoded, the trace looks like this
ENTER: \example\blink.c:38 <- \example\blink.c:77
ENTER: \example\blink.c:30 <- \example\blink.c:57
EXIT:  \example\blink.c:30 <- \example\blink.c:57
EXIT:  \example\blink.c:38 <- \example\blink.c:77
With a little scripting, you could easily automate the log capture and decoding. At that point, you’ve got yourself a poor man’s trace tool for Cortex-M0 and M0+ cores.
What Next?
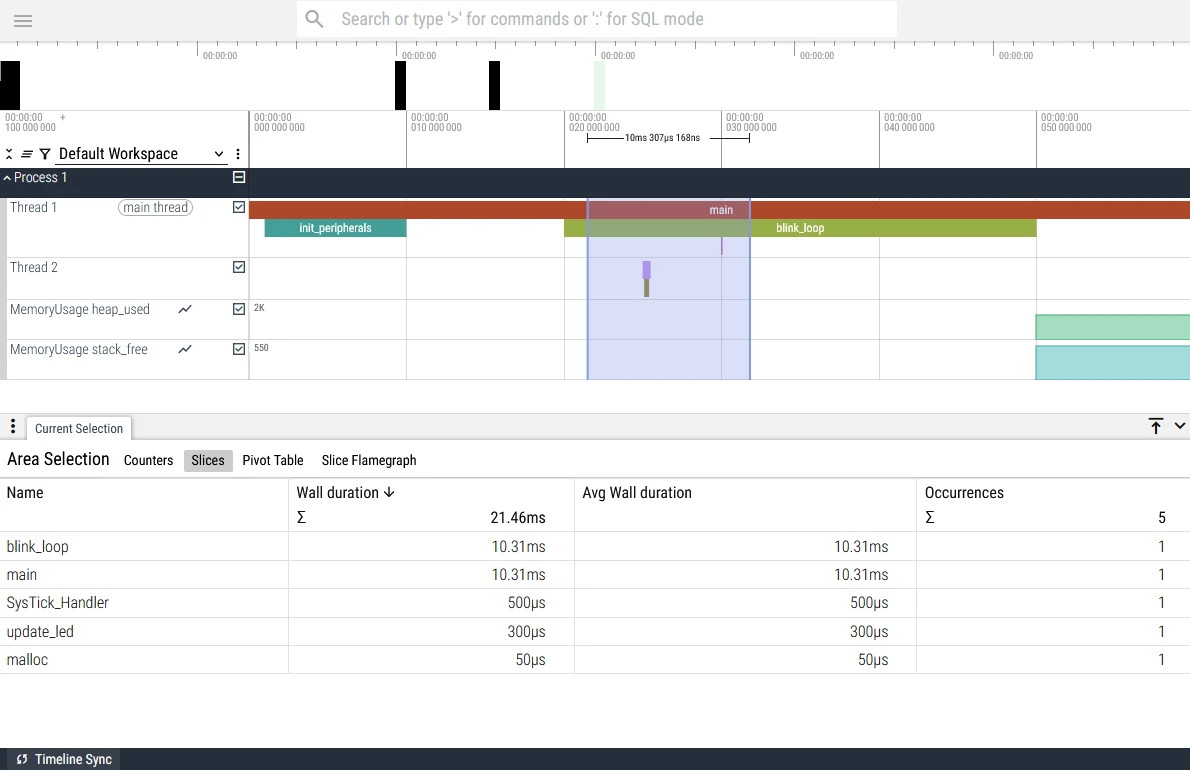
Getting a text trace is already a significant improvement, but imagine having a visual overview of your system’s execution. Tools like Eclipse Trace Compass and Perfetto can take trace files and transform them into interactive timelines, graphs, and performance metrics. While these tools are primarily designed for Linux kernel and Android development, they can parse trace files from any source as long as the data is formatted correctly.
So, what if we took this a step further? By writing custom trace functions and parsing scripts, we could output logs in a format compatible with these tools. This would allow us to visualize the execution of our Cortex-M0/M0+ applications, just like in this example.

Conclusion
Using -finstrument-functions selectively is a handy way to debug and trace function calls on chips without hardware tracing support. You get enter/exit hooks automatically, without needing to sprinkle logging code all over your project. And when you’re done, just remove the compile flag and your build is back to normal.

Debugging Microsecond Delays on STM32: When 1 µs Isn’t What It Seems
Why your STM32 timer-based microsecond delays may not work as you expect. Discover how Cortex-M0+ pipelines and timer register updates can affect your timing. Learn ways to correct these issues.

Advanced RTT in Embedded Rust: A Guide to Multi-Channel Logging and Binary Streaming (Part 1)
Learn to set up multi-channel RTT on the Pi Pico: structured logging with defmt, debug prints, and host commands—all over a single SWD/JTAG probe.

How to Embed Binary Information in Your Rust Pi Pico Firmware
Embed binary metadata in your Rust Pi Pico firmware with picotool! Learn how to store program names, versions, build dates, and more in flash, so you can easily track firmware details with a single command.
Whether you're building something new, fixing stability issues, or automating what slows your team down — we can help.

