How to Use RTT in Embedded Rust: Setup and Logging
Learn how to use RTT in Embedded Rust for fast, non-blocking debug logging. This guide covers setup, rtt-target usage, OpenOCD configuration, and VS Code auto-start.

What is Real-Time Transfer (RTT)?
Real-Time Transfer, or RTT, is a high-speed debugging mechanism developed by SEGGER. It allows your microcontrollers to chat with your computer over the SWD/JTAG debug probe. No UART, USB, or extra pins needed!
It works by setting up ring buffers in your microcontrollers RAM. The debug probe keeps an eye on these buffers and shuttles data back to your host PC (or vice versa). Since the CPU doesn’t stop and there’s no slow semihosting involved, RTT is fast, non-blocking, and perfect for logging, debugging, or even sending binary data.
Adding to Your Embedded Rust Project
For Rust developers, the rtt-target crate makes it easy to print and interact with RTT channels. See crates.io for more information.
Step 1: Add the Dependencies
First, add these crates to your Cargo.toml:
[dependencies]
panic-rtt-target = "0.2.0"
rtt-target = "0.6.2"
The panic-rtt-target crate ensures panic messages show up in your RTT output instead of silently crashing.
Step 2: Initialize Early
RTT needs to be initialized before you use any rprintln! macros. In your #[entry] function, add:
use rtt_target::{rtt_init_print, rprintln};

#[entry]
fn main() -> ! {
    rtt_init_print!();
    rprintln!("RTT initialized!");

    loop {}
}
If you’re using RTIC or Embassy, place the initialization inside the init function.
Step 3: Verify your memory layout
Check your .map file to confirm where the "SEGGER RTT" control block is placed. For example, on a Pi Pico, it’s usually at the start of RAM (0x20000000).
Have a look at an earlier blog post "How to Find the Memory Address of a Symbol in an ELF File". The tips and tricks also work with Rust built binaries!
Step 4: Add logging calls
Now you can log messages like this:
rprintln!("Hello from RTT!");
// or
rprint!("Something without a newline");
These macros behave similarly to println!, but without blocking the CPU.
Viewing RTT Output
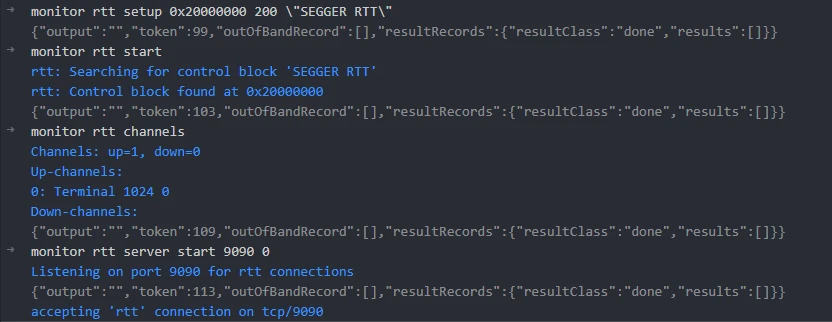
When we have started the debug session, the initialization of RTT will create a control block in RAM.

Once the control block is created we can issue the following commands to setup RTT to start viewing the output.
monitor rtt setup 0x20000000 200 "SEGGER RTT"
monitor rtt start
monitor rtt channels
monitor rtt server start 9090 0These commands must be issued in the GDB session. On VS Code it is the "Debug Console" and escaping \" might be necessary.

Finally, we can connect to the RTT server and view the output. We can use the telnet to view the data stream from our microcontroller.
$ telent localhost 9090
RTT initialized!
Starting main loop!
Auto Configuring RTT in VS Code
If you’re using the Cortex-M Debug extension, you can auto-configure RTT in your launch.json:
"rttConfig": {
    "enabled": true,
    "address": "auto",
    "decoders": [
        {
            "label": "RTT Terminal",
            "port": 0,
            "type": "console",
            "timestamp": true
        }
    ]
}
When you start debugging, a new terminal will pop up with your RTT logs.

What's Next?
We’ll dive deeper into RTT, exploring multiple channels, using RTT with C, and more. Stay tuned!
I’ve also put together a bare-bones Rust and Pi Pico project using RTT on GitHub. Have a look 🚀 HERE

Including External Libraries in CMake Projects
Learn how to use CMake’s FetchContent module to automatically download and integrate libraries like CMSIS into your embedded projects, eliminating the hassle of manual copying and updates.

Managing Multi-Compiler CMake Projects in VS Code
Learn how to build host utilities alongside embedded firmware in CMake by using ExternalProject. This guide covers setting up multiple compilers, integrating utility projects, and configuring VS Code workspaces for smooth IntelliSense.

Tools as a Service: A Modern Approach to Embedded DevOps
Ditch dependency hell and manual setups. Learn how to build the Tools as a Service stack, a container-first architecture for scalable embedded development.
Whether you're building something new, fixing stability issues, or automating what slows your team down — we can help.

