How to Find the Memory Address of a Symbol in an ELF File
A quick and useful tip for locating symbol memory addresses in ELF files using arm-none-eabi-nm combined with grep—perfect for embedded debugging scenarios like setting up SEGGER RTT or inspecting linker placements and runtime symbols.

Here’s a handy tip that came up during some work with SEGGER RTT (Real Time Transfer).
When initializing an RTT session, you need to provide the memory address of the RTT static control block variable. While it’s possible to dig through your generated .map file, there's a faster way:
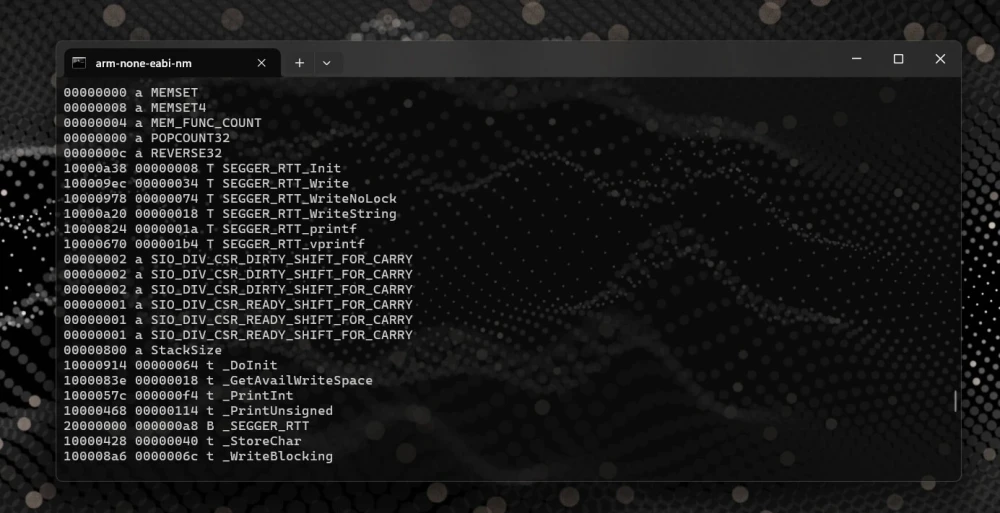
arm-none-eabi-nm blink.elf | grep _SEGGER_RTT
20000000 B _SEGGER_RTT
By piping the output of arm-none-eabi-nm (which lists all symbols in your .elf file) to grep, you can quickly isolate and retrieve the memory address of your desired symbol.
Note: For Windows users, grep is typically a Linux command. However, you can easily use this trick with tools like WSL (Windows Subsystem for Linux), Cmder, or Git Bash.
arm-none-eabi-nm firmware.elf | grep foo
1000033c T foo
This technique isn't limited to variable addresses, it's equally useful for finding function or constant data addresses. Variable symbols are typically stored in volatile RAM, while function code and constant data usually reside in non-volatile ROM or Flash memory, reflecting their runtime mutability or immutability.

Tools as a Service: A Modern Approach to Embedded DevOps
Ditch dependency hell and manual setups. Learn how to build the Tools as a Service stack, a container-first architecture for scalable embedded development.

Creating a Containerized Remote Serial Interface with Docker and Socat
Learn how to set up remote serial communication for embedded development using Socat, Docker, and Raspberry Pi. Streamline UART access and debug from anywhere!

How to Use RTT in Embedded Rust: Setup and Logging
Learn how to use RTT in Embedded Rust for fast, non-blocking debug logging. This guide covers setup, rtt-target usage, OpenOCD configuration, and VS Code auto-start.
Whether you're building something new, fixing stability issues, or automating what slows your team down — we can help.