Remote Real Time Transfer (RTT) Setup: Interfacing from Anywhere
Struggling with remote debugging? Discover how to set up Segger’s RTT for real-time logging using OpenOCD, Raspberry Pi, and a Pi Debug Probe, plus the pitfalls I faced and how to avoid them.

In recent posts, we explored building remote accessible tooling for debugging, serial interfacing, and visuals. If you’ve been following along with our Remote Debugging post, you already know how powerful OpenOCD can be for debugging embedded systems. What you might not know is that OpenOCD also supports Segger's Real-Time Transfer (RTT), a lightweight, high-speed communication channel that rides on the debug connection. It is perfect for logging, debugging, or streaming real-time data.
We have touched on RTT before, but from a Rust and non-remote perspective. In this post, we'll walk through setting up RTT for remote access using a Raspberry Pi Pico and a Pi Debug Probe. Let's dive in!
The Toolkit
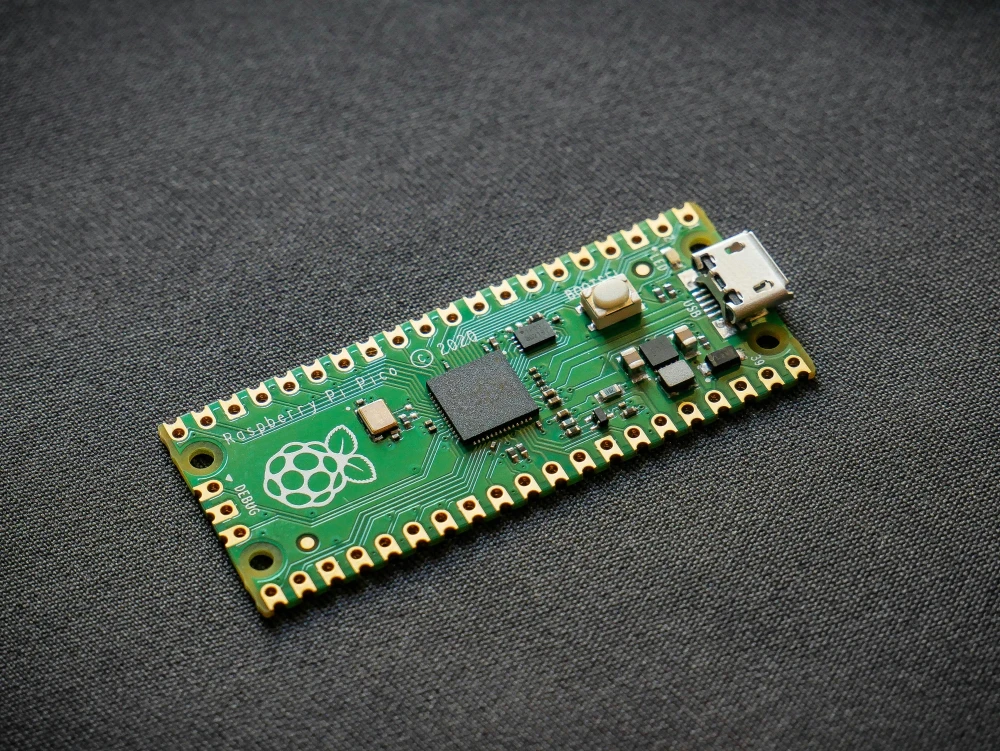
To follow along, you’ll need:
- Raspberry Pi Pico or (Pico W) as our target device
- Pi Debug Probe for flashing, debugging and RTT interface
- CMake to build the project
- Raspberry Pi 4 as our remote host
Adding RTT to Your Pico Project
The easiest way to integrate SEGGER RTT is by pulling the code directly from GitHub using CMake’s FetchContent.
include(FetchContent)

FetchContent_Declare(
  RTT
  GIT_REPOSITORY https://github.com/SEGGERMicro/RTT.git
  GIT_TAG        main
)
FetchContent_MakeAvailable(RTT)
Next, we need to link RTT to our project
add_library(segger_rtt STATIC
  ${rtt_SOURCE_DIR}/RTT/SEGGER_RTT.c
  ${rtt_SOURCE_DIR}/RTT/SEGGER_RTT_printf.c
)

target_include_directories(segger_rtt PUBLIC
  ${rtt_SOURCE_DIR}/RTT
  ${CMAKE_SOURCE_DIR}/src/lib/config # Path to SEGGER_RTT_Conf.h
)

target_compile_options(segger_rtt PRIVATE ${TARGET_COMPILE_OPTIONS})
target_link_options(segger_rtt PRIVATE ${TARGET_LINKER_OPTIONS})

target_link_libraries(${CMAKE_PROJECT_NAME} segger_rtt)
Finally, initialize and use RTT in our code
#include <stdio.h>
#include "pico/stdlib.h"
#include "SEGGER_RTT.h"

int main()
{
    SEGGER_RTT_Init();
    SEGGER_RTT_WriteString(0, "RTT Initialized!");

    // Your blink code here...
}
And that’s it! You’ve now got RTT set up in your project.
Stream RTT Remotely
Now, let’s get RTT streaming to our remote host. First we need to find the RTT Control Block Address:
arm-none-eabi-nm blink.elf | grep _SEGGER_RTTThis grabs the RAM address where the RTT control block is stored. Next, run the following command to initialize RTT:
monitor rtt setup <address_from_last_step> 0x100OpenOCD on Windows might need SEGGER as last parameter to the rtt setup command
This tells OpenOCD where to find the RTT control block and how many bytes of memory (0x100) to scan when it looks for the control block structure.
The monitor command sends instructions directly to the GDB server, not your local GDB instance.
Before starting RTT, ensure the SEGGER_RTT_Init() function has run in your code. Then, issue:
monitor rtt startTo stream RTT over TCP, run:
monitor rtt server start 9090 0This starts a TCP server on port 9090 for RTT channel 0. Back in VS Code, open the Serial Monitor and switch to TCP mode. Enter your remote host’s IP address and port 9090, then hit Start. Resume debugging, and there you have it, RTT logs will stream directly to VS Code!

Automating RTT Setup
The setup we have is already quite good, but the manual work we need to do, for setting up RTT when we start debugging is quite annoying. So lets fix that!
We can achieve this by creating a handy gdb function that we then can call as a post launch command. First, create a .gdbinit file at the root of our project and a add a bare bones function definition.
set breakpoint auto-hw on
set print pretty on

define mp_setup_rtt
    echo "hello"
end
If you save and start a new debug session, you might run into this warning:
Finished reading symbols from objdump: Time: 27 ms
warning: File "D:\Work\blinky\.gdbinit" auto-loading has been declined by your `auto-load safe-path' set to "$debugdir:$datadir/auto-load".
To enable execution of this file add
	add-auto-load-safe-path D:\Work\blinky\.gdbinit
line to your configuration file "C:\Users\Me/.gdbinit".
To fix this, navigate to your user home directory and create a .gdbinit file there. Add the following line:
add-auto-load-safe-path D:/Work/blinky/.gdbinitIf you’re on Windows and still see the warning, you might be missing the HOME environment variable. Add HOME with the path to your user home directory to your environment variables.
Now, if you run the mp_setup_rtt command in the Debug Console, you should see hello printed. Progress!
Now that we have the gdb setup in place lets move to actually automating the whole process. In summary we need to:
- Get the
SEGGER_RTTaddress and use it to set up RTT. - Wait for
SEGGER_RTT_Initto finish setting up the control block. - Start RTT and the TCP server.
- Teardown RTT if the debug session finishes.
- Add the GDB commands to
launch.json.
Step 1: Setup RTT in GDB
Since GDB has your symbols from the .elf file, you can directly query the symbol address. In the Debug Console, print the address of the symbol:
print &_SEGGER_RTT
$1 = (SEGGER_RTT_CB *) 0x20002868 <_SEGGER_RTT>
You can also store the symbol’s address in a variable and use it to set up RTT:
set $rtt_addr = &_SEGGER_RTT
eval "monitor rtt setup 0x%x 0x100", $rtt_addr
Step 2: Wait for RTT Initialization
We need to wait for SEGGER_RTT_Init to finish running. We could set a break point at some point in code after the init function, but that would not be portable. Instead we set a temporary breakpoint at the start of the init function:
tbreak SEGGER_RTT_Init
commands
    # Rest of the commands here
endThe tbreak set a breakpoint in code, once it is hit the breakpoint is removed.
We need to now somehow break again after the init function to run the RTT start commands. We will use the link register $lr, it holds the return address that the program jumps to after running SEGGER_RTT_Init. However, the 0th bit holds info about Thumb mode, so we need to remove that bit to break at the actual address.
set $ret_addr = $lr & ~1Finally, add another temporary breakpoint at the return address:
tbreak *$ret_addr
commands
    # Rest of the commands
end
Step 3: Start RTT and the TCP Server
Once we hit the second temporary breakpoint, we know the initialization is complete, and we can start RTT. Here’s the full command:
define mp_setup_rtt
    set $rtt_addr = &_SEGGER_RTT
    eval "monitor rtt setup 0x%x 0x100", $rtt_addr

    tbreak SEGGER_RTT_Init
    commands
        set $ret_addr = $lr & ~1

        tbreak *$ret_addr
        commands
            monitor rtt start
            monitor rtt server start 9090 0
            continue
        end

        continue
    end
end
Step 4: Teardown Function to Stop RTT
When you attach to a remote debug session, RTT might still be running from a previous command. To ensure RTT is torn down, add this command:
define mp_teardown_rtt
    monitor rtt server stop 9090
    monitor rtt stop
end
This stops RTT and the TCP server.
Step 5: Add to VS Code
Finally, we can add these commands to launch.json and call these commands automatically during our debug session.
{
    "version": "0.2.0",
    "configurations": [
        {
            "name": "Remote Debug with OpenOCD",
            "cwd": "${workspaceRoot}",
            "executable": "${command:cmake.launchTargetPath}",
            "request": "launch",
            "type": "cortex-debug",
            "servertype": "external",
            "postLaunchCommands": [
                "mp_setup_rtt 9090 0"
            ],
            "gdbTarget": "10.10.10.10:3333",
            "svdFile": "${env:PICO_SDK_PATH}/src/rp2040/hardware_regs/rp2040.svd",
            "runToEntryPoint": "main",
            "showDevDebugOutput": "none",
            "preRestartCommands": [
                "mp_teardown_rtt"
            ],
            "interface": "swd",
            "liveWatch": {
                "enabled": true,
                "samplesPerSecond": 2
            }
        },
    ]
}
Final Thoughts
Now that you’ve seen the process (and the missteps), you’re ready to stream RTT logs from anywhere, without the headaches. Happy debugging!

Simplifying OpenOCD Deployment with a Debian Package
Instead of manually copying binaries and dependencies across machines, you can package OpenOCD into a Debian .deb archive. This post walks through creating a custom package to simplify installation and distribution.

Welcome to The Crab Lab: Diving into Embedded Rust (and Maybe Some Memes)
Are ya ready, Kids? Dive into The Crab Lab, a new series exploring Embedded Rust through tutorials, projects, and troubleshooting tips. Join the journey of learning, experimenting, and building with Rust on microcontrollers.

A Simple Guide to DNS and Privacy
DNS translates domain names into IP addresses, but its unencrypted queries can expose your browsing habits. Learn how DNS works, what data is exposed in plaintext, and why it matters for your privacy — with hands-on examples.
Whether you're building something new, fixing stability issues, or automating what slows your team down — we can help.